Economic Spotlight
Carbon Arc Data Assets: POS - Supermarket, Menu Data, Credit Card - US Complete Panel, POS - Convenience Stores, POS - Instore and Online, Trade Claims
Rising Prices and Impacts on Demand
November 11, 2025
Executive Summary
Food inflation became a major issue in 2021 and 2022, when data from the Department of Agriculture showed spending as a share of income reached its highest level since 19931. However, while overall inflation numbers have lowered, consumers are still struggling with current price levels, already up 25% between 2020 and 20242, with 68% of consumers in Michigan’s October 2025 Sentiment Survey expecting their incomes wouldn’t keep up with inflation over the next 12 months – tying the record high3. This sentiment is becoming evident in consumer behavior. In their 2Q25 earnings call, Albertsons CEO Susan Morris mentioned that their consumers are shifting to smaller package sizes4. Carbon Arc POS data can be used to track the changing price of groceries and restaurant meals and its impact on consumers at supermarkets, convenience stores, mass merchandisers, and restaurants.
Key Takeaways
-
At supermarkets, shelf prices and the prices consumers actually pay have both risen by roughly 3% annually in 2025. However, the amount consumers spend per item increased by much less than price inflation in 2024, indicating shoppers are trading down or purchasing lower-priced alternatives.
-
Shelf prices for sodas and processed foods have risen far more quickly than for meat and produce, which have decreased in price in 2025.
-
In 3Q25, restaurant menu prices rose 3% — the slowest pace since at least 2023 — with the largest increases along the coasts and minimal growth in Central regions.
-
In Fine Dining, consumers are spending less per visit but maintaining visit frequency, while in Casual Dining, they are spending more per visit but going less often.
-
Per-item spend on alcohol at supermarkets fell 2% Y/Y in October, the largest drop since 2019, after alcohol spend maintained pace with price increases through August 2025.
-
At mass merchandisers, the highest-income cohort has led spend-per-item growth in five of the last six quarters, after underperforming from 3Q22–2Q24.
-
EBT users at convenience stores have increased spend per item by 2–6% Y/Y, compared with 0–2% growth among other payment users since 3Q24, including negative growth quarter-to-date.
-
U.S. maritime food imports are down Y/Y, following a sharp slowdown in July when the “reciprocal tariffs” announced in April took effect.
Food Inflation at Supermarkets
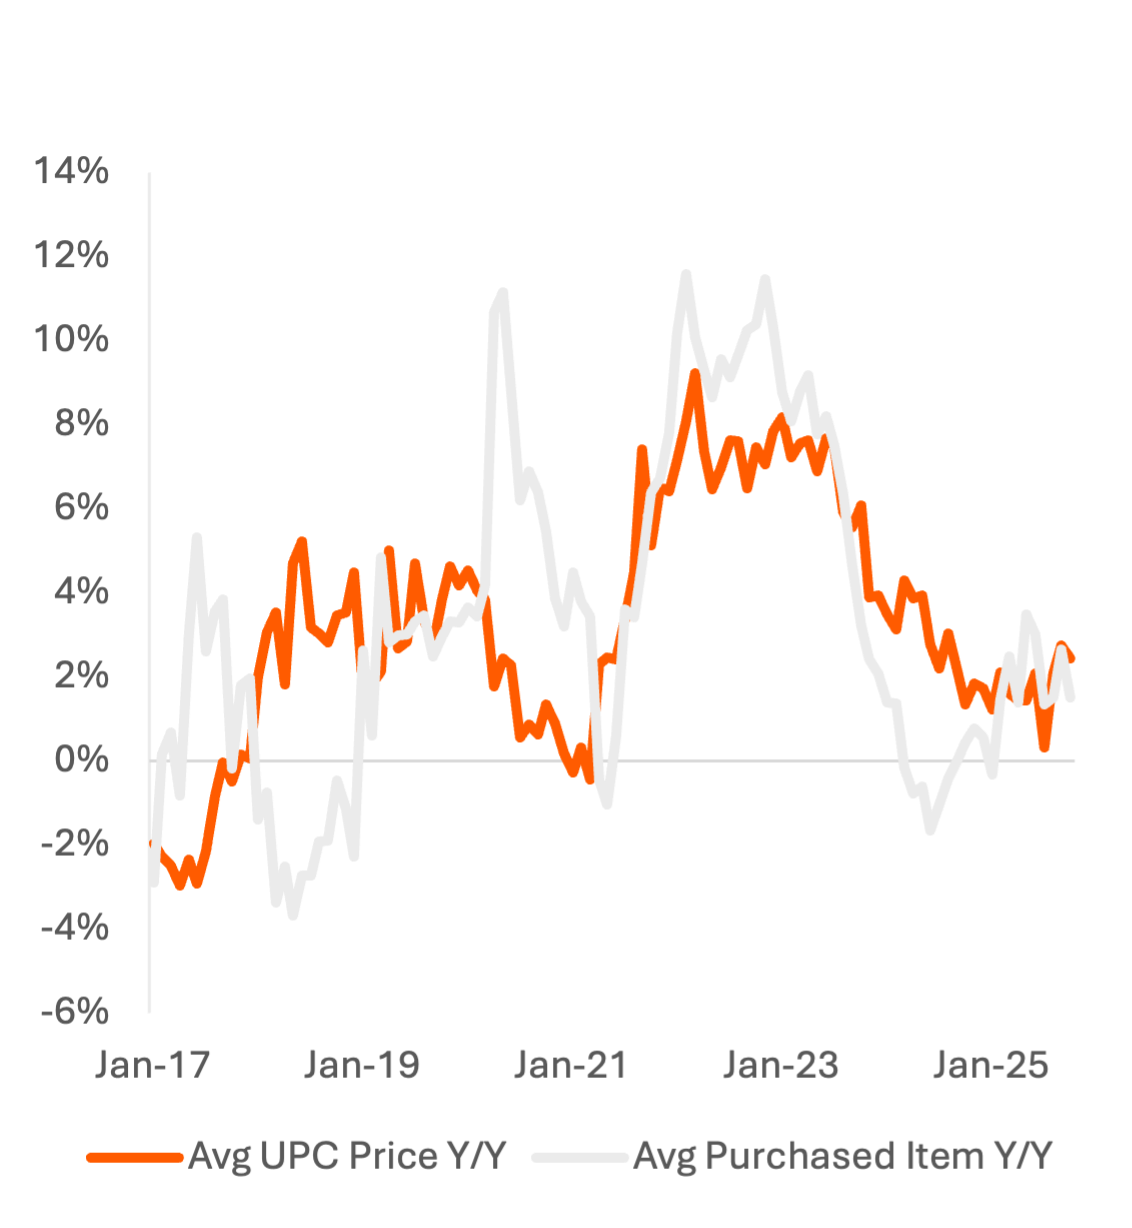
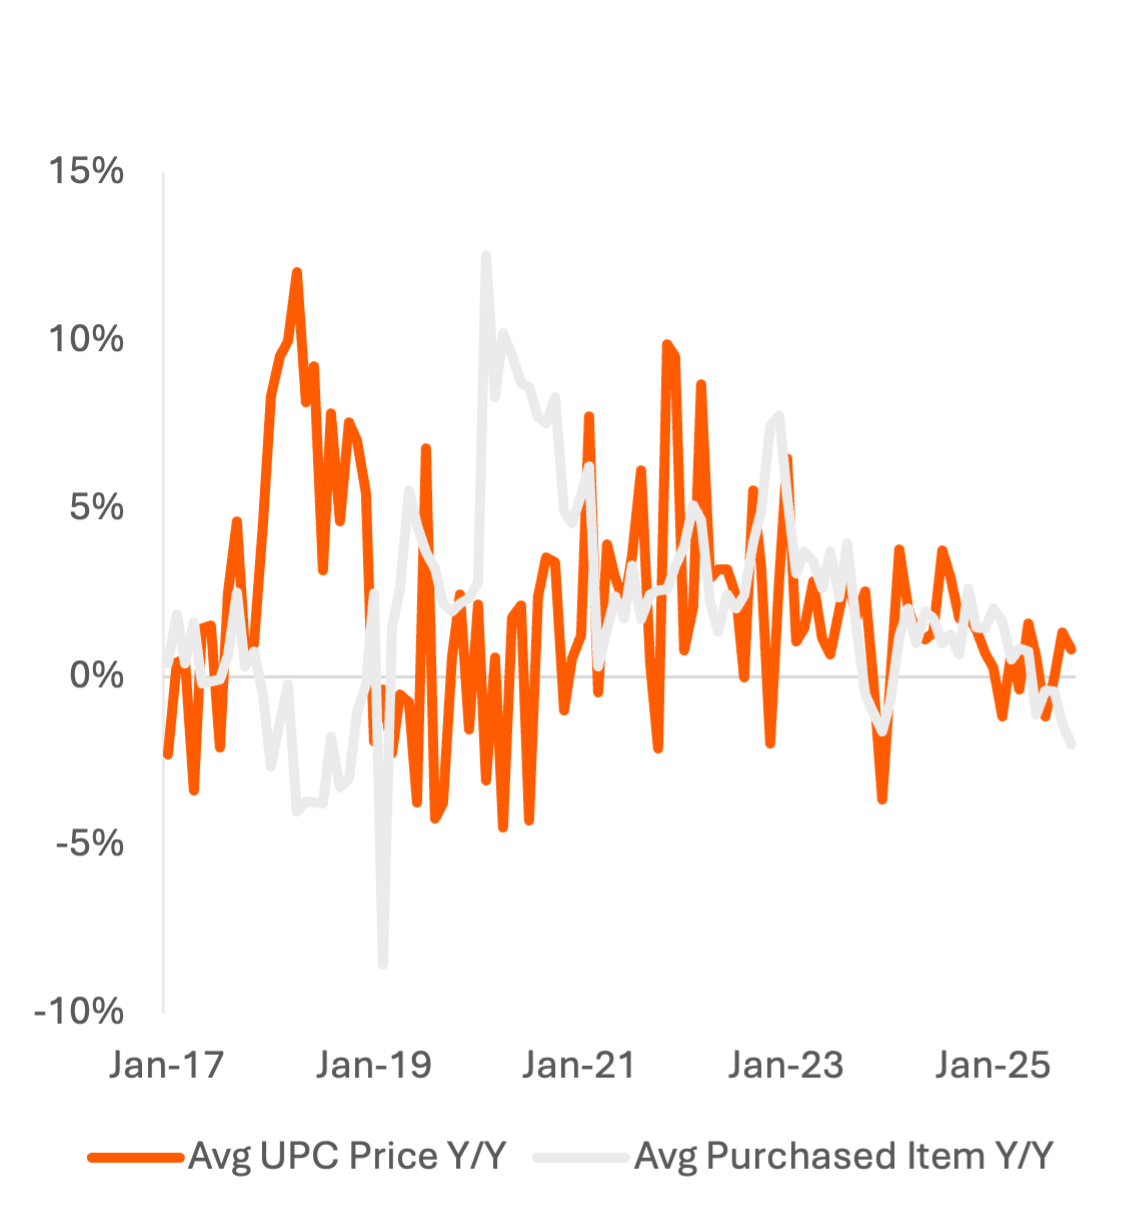
Prices and per-item spending at supermarkets increased substantially in 2022-2023 before decelerating significantly. Post-tariffs, average item price growth has remained in the 1–3% Y/Y range. At a category level, prices of soft drinks have risen the most from 2022-2025, followed by other processed foods and Dairy & Eggs. Shelf prices of meat, seafood, and produce have risen less than 6% total since 2022.
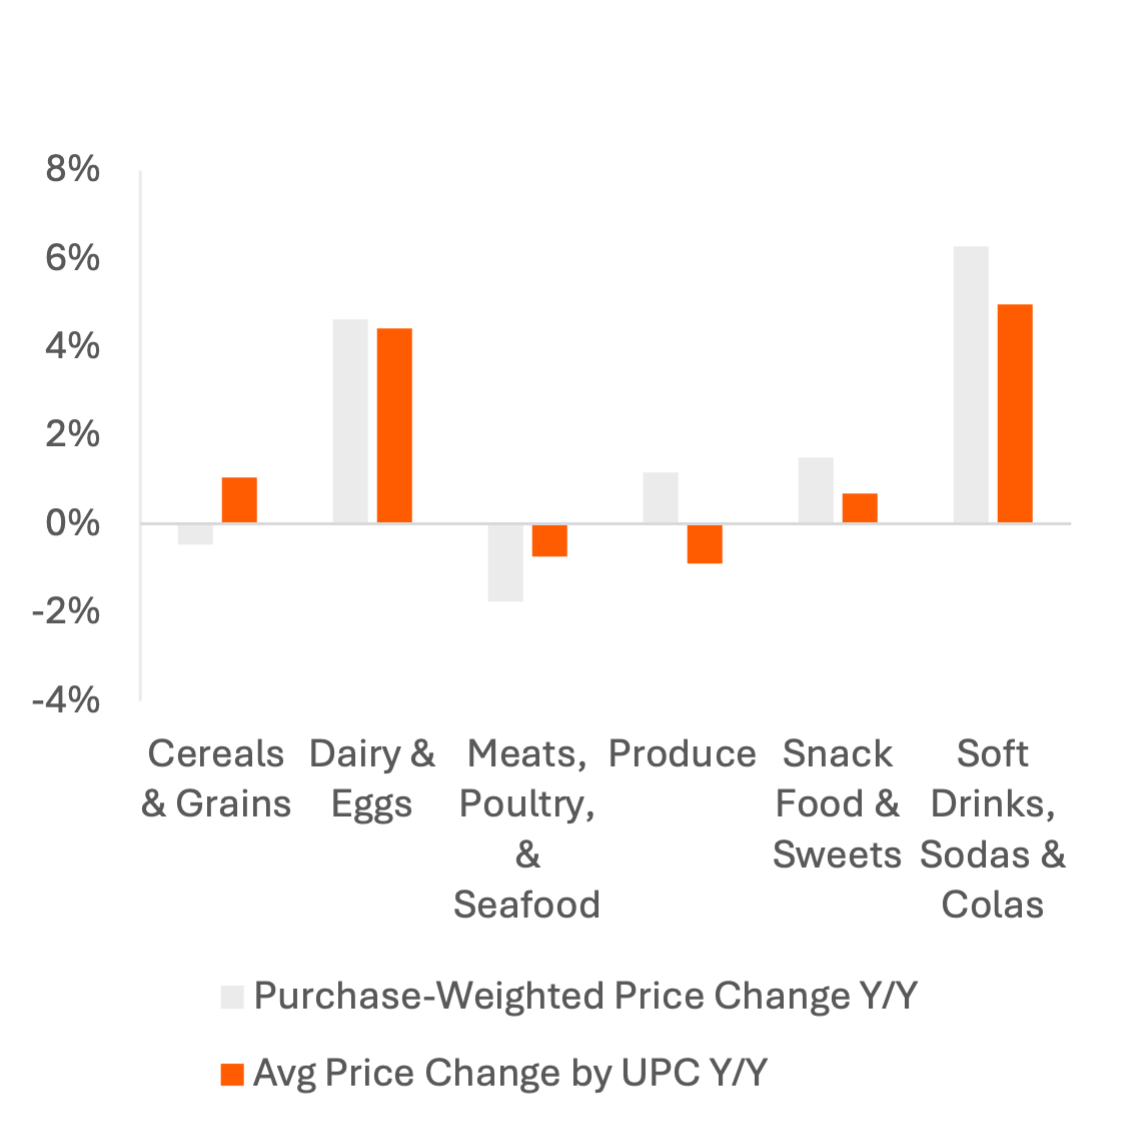
Comparing prices by UPC code to the average price of all purchased units in the panel shows consumers shifted towards larger or more-expensive items during Covid and again in 2022 before shifting back towards lower-priced items in 2024. 2025 trends are similar for both shelf stickers and purchased units but vary significantly by category. Consumers have consistently bought more-expensive soft drinks even as base prices increase; Coca-Cola’s 20245 and 20256 10-Ks cited both price increases and more-expensive product mix as drivers of 8% and 10% average price increases in North America in 2023 and 2024.
In Cereals & Grains and Snack Food & Sweets, consumers are trading down, lowering the average price of items purchased. Consumers buying larger snack food items in 2025, reversing trends from 2023 and 2024 may be a contrarian signal to the rise of GLP-1s or a shift to healthier and more-expensive brands.
Exhibit 1: Y/Y Change in Avg Supermarket Price by UPC vs. Avg Price of Purchased Units
Price: Requires row-level bulk data access, available on request
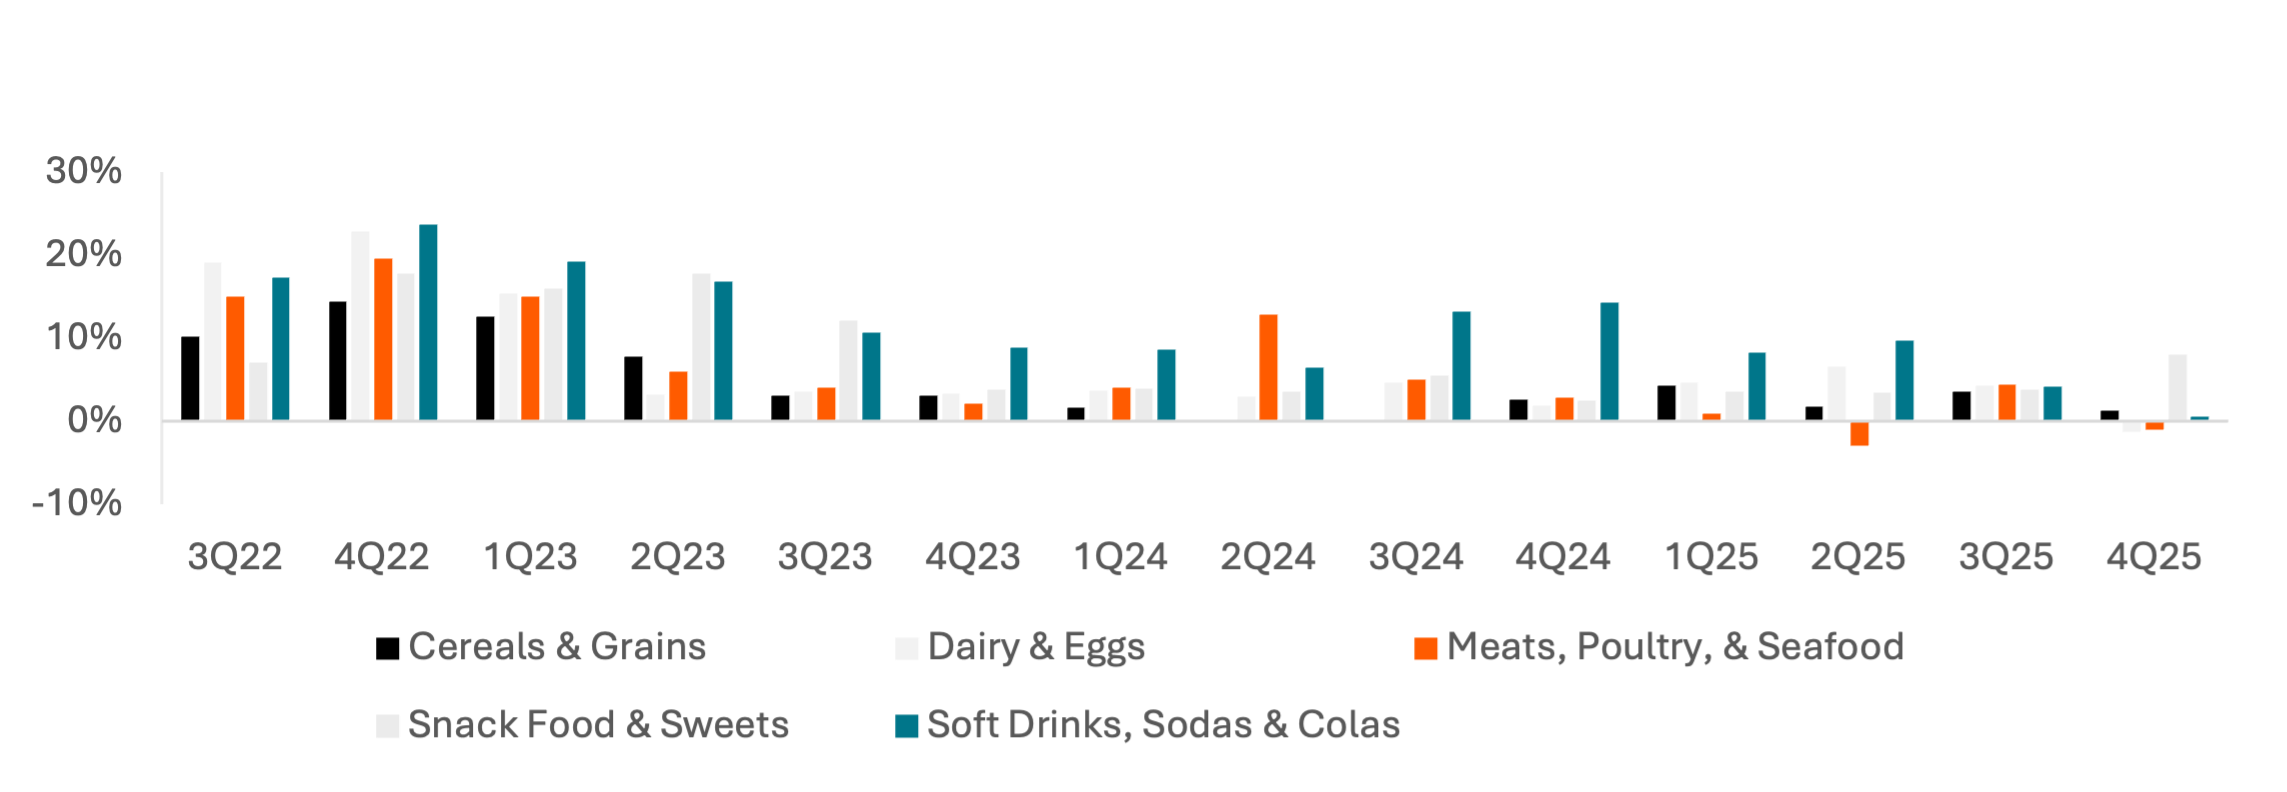
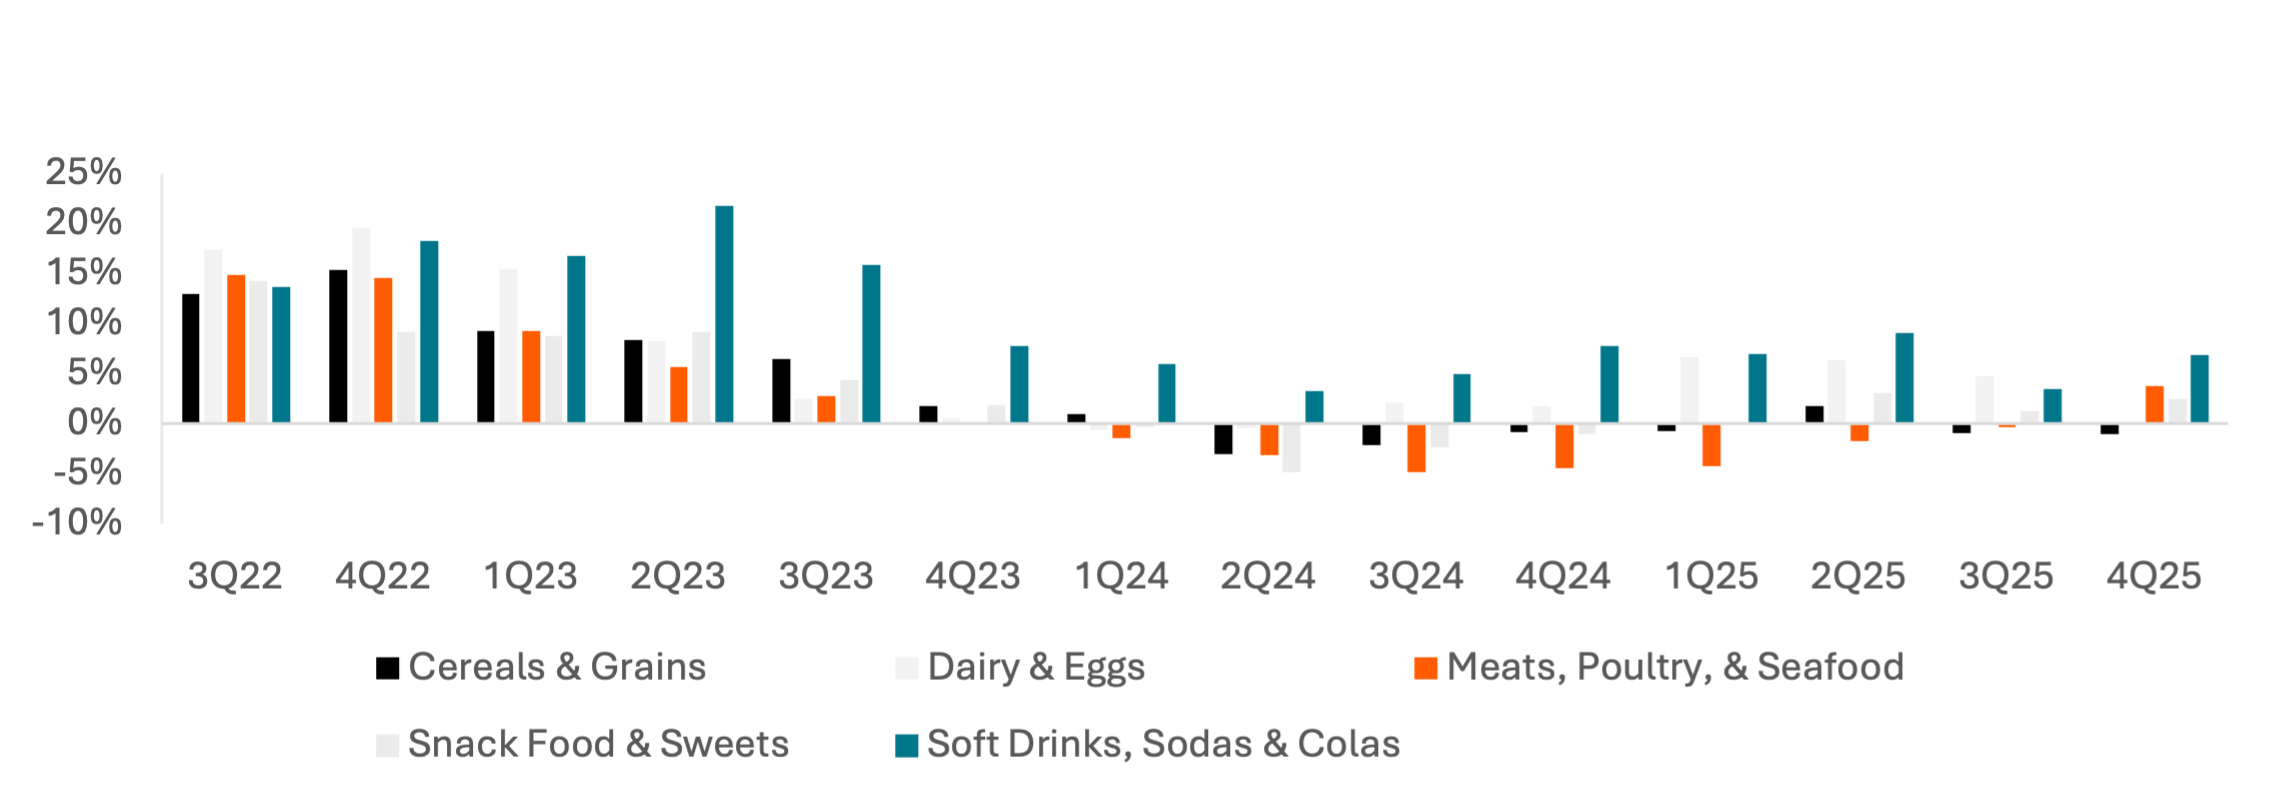
Exhibits 2-4: Y/Y Change in Avg Price by UPC Code vs. Avg Price of Purchased Units, by Category
Exhibit 2: 2023
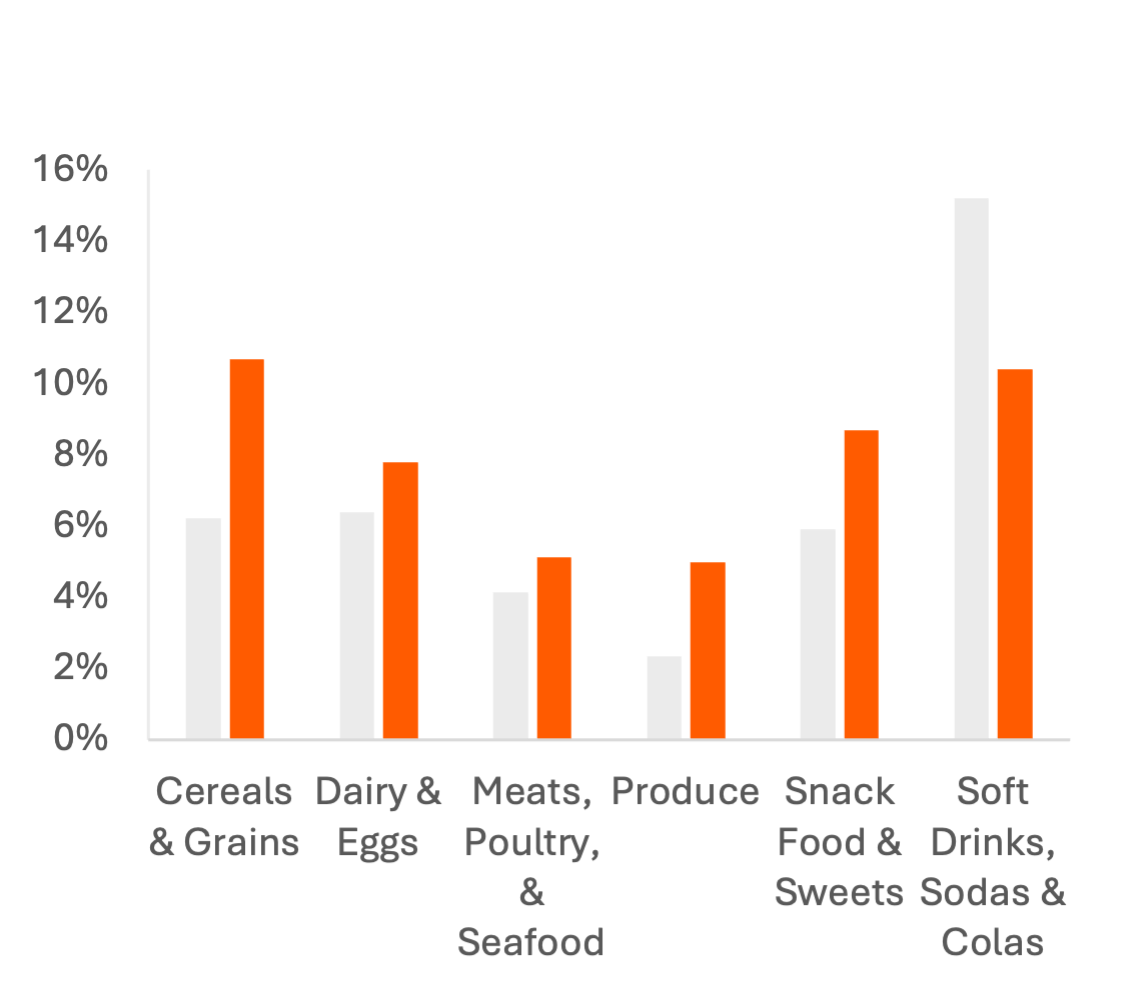
Exhibit 3: 2024
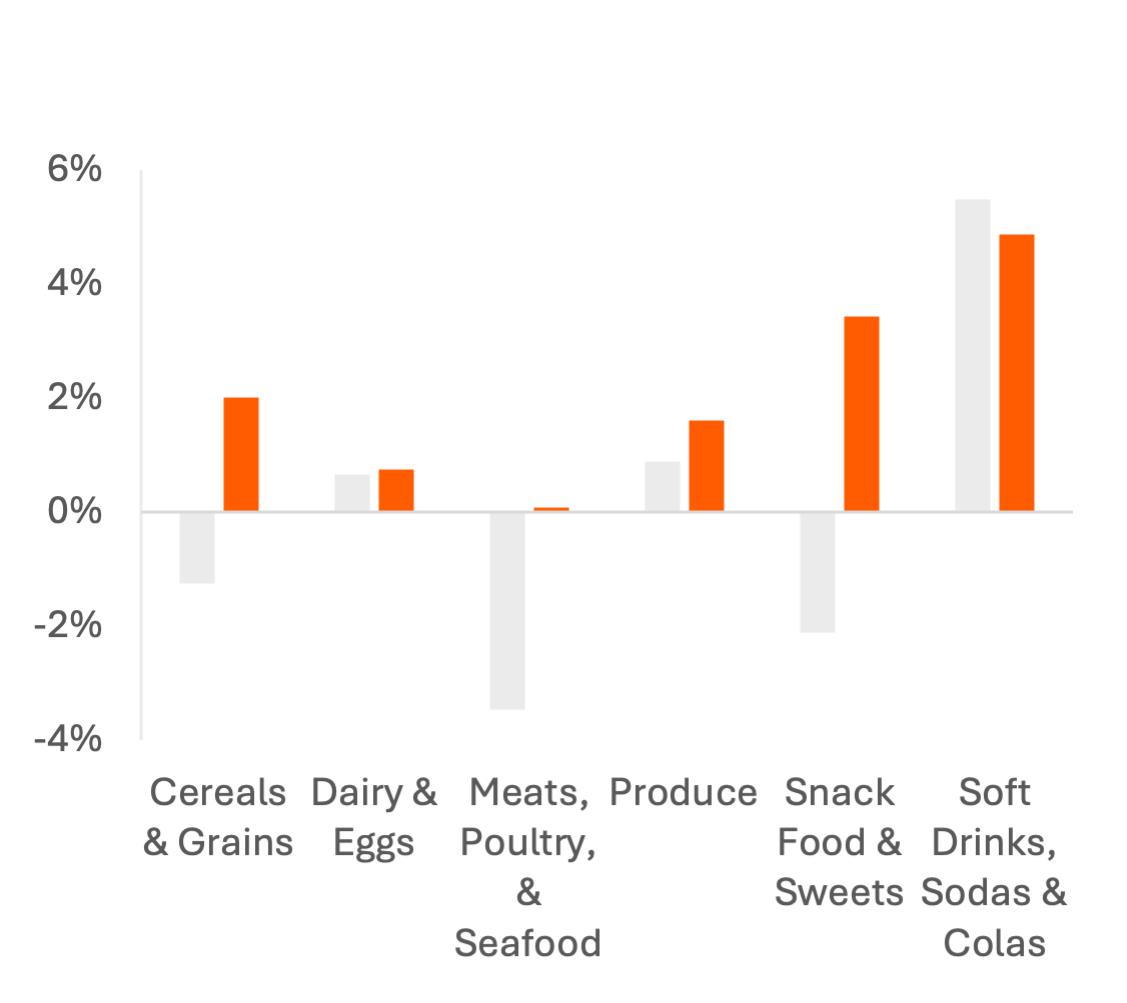
Exhibit 4: 2025
Price: Requires row-level bulk data access, available on request
Food Inflation at Restaurants
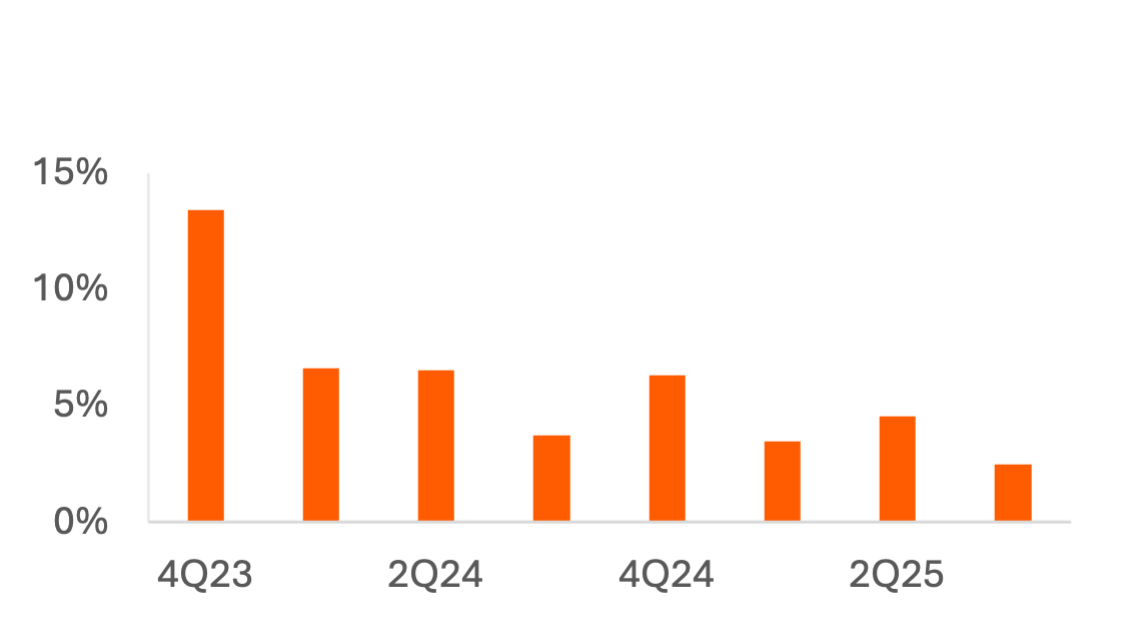
Scraped restaurant menus from Carbon Arc’s Menu Data Asset indicate that following an average item price increase of 13% between 4Q22 and 4Q23, price growth has steadily decelerated to 2.5% average growth in 3Q25, much more in-line with overall inflation numbers. Consumer transaction value growth of ~2% Y/Y from 2Q24 – 3Q25 did not keep up with the 3-6% average price increase of menu items, but QSR transaction values are up 2.7% Y/Y in 4QTD, indicating a possibility that transaction value growth is fully catching up to pricing growth.
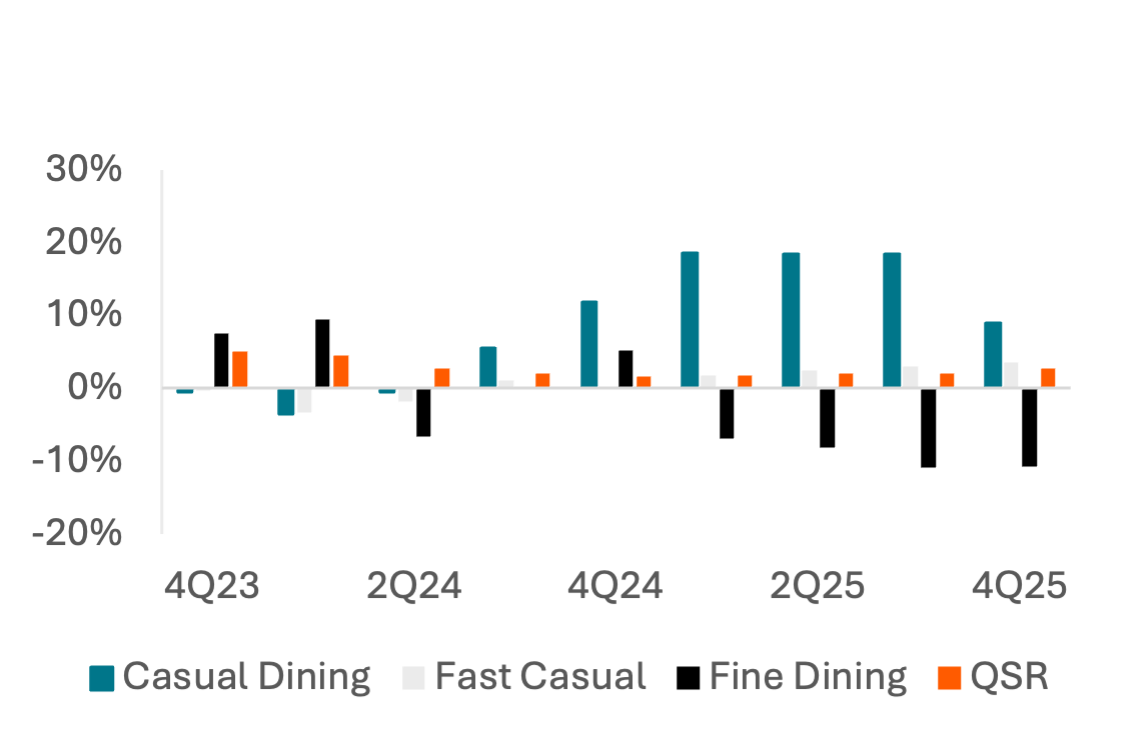
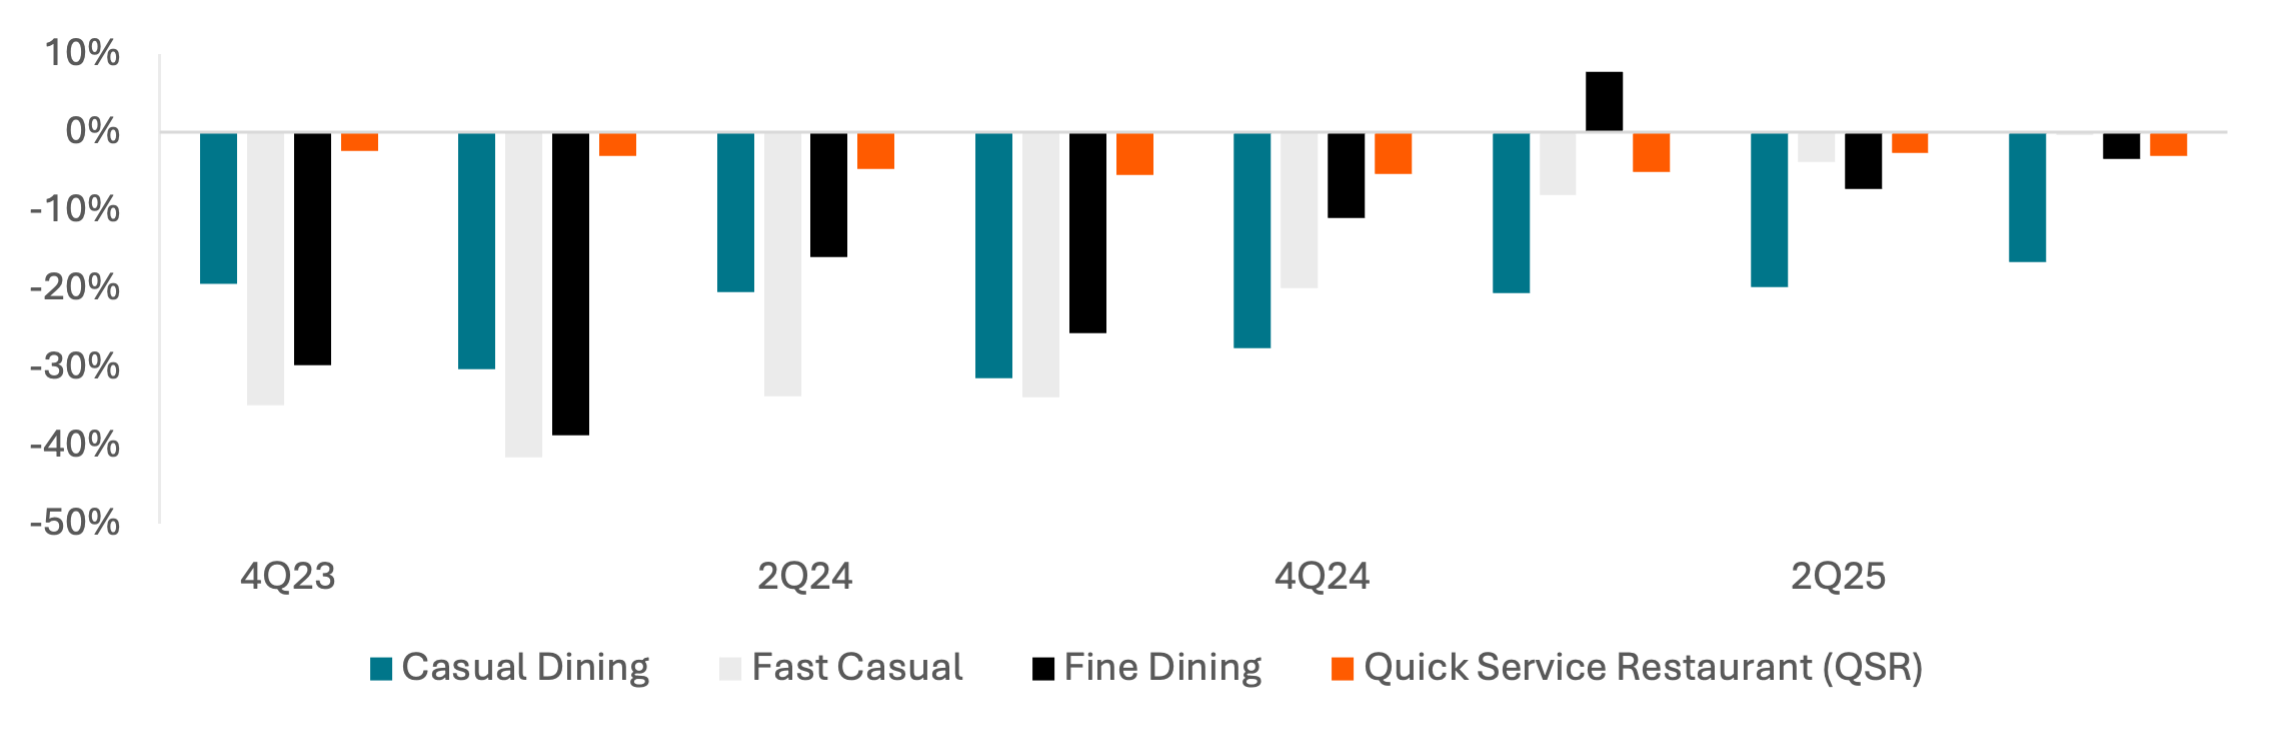
However, the catch-up to menu price increases in QSR occurs as transaction value growth is falling in Fine Dining and rising in other categories like Casual Dining, suggesting consumers could be trading down within dining categories or just cutting back on the size of their orders. Transaction volume insights suggest consumers are continuing to transact at similar levels in Fine Dining, but the per-transaction increase in Casual Dining may be driven by consumers reducing the frequency of their visits.
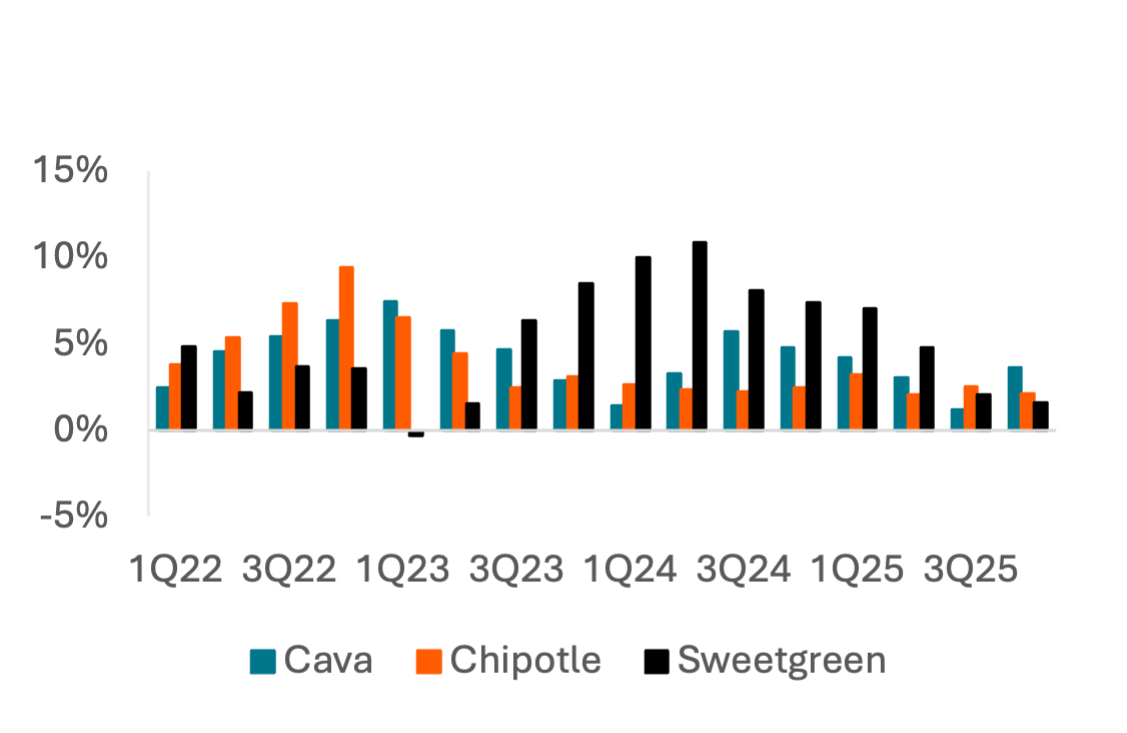
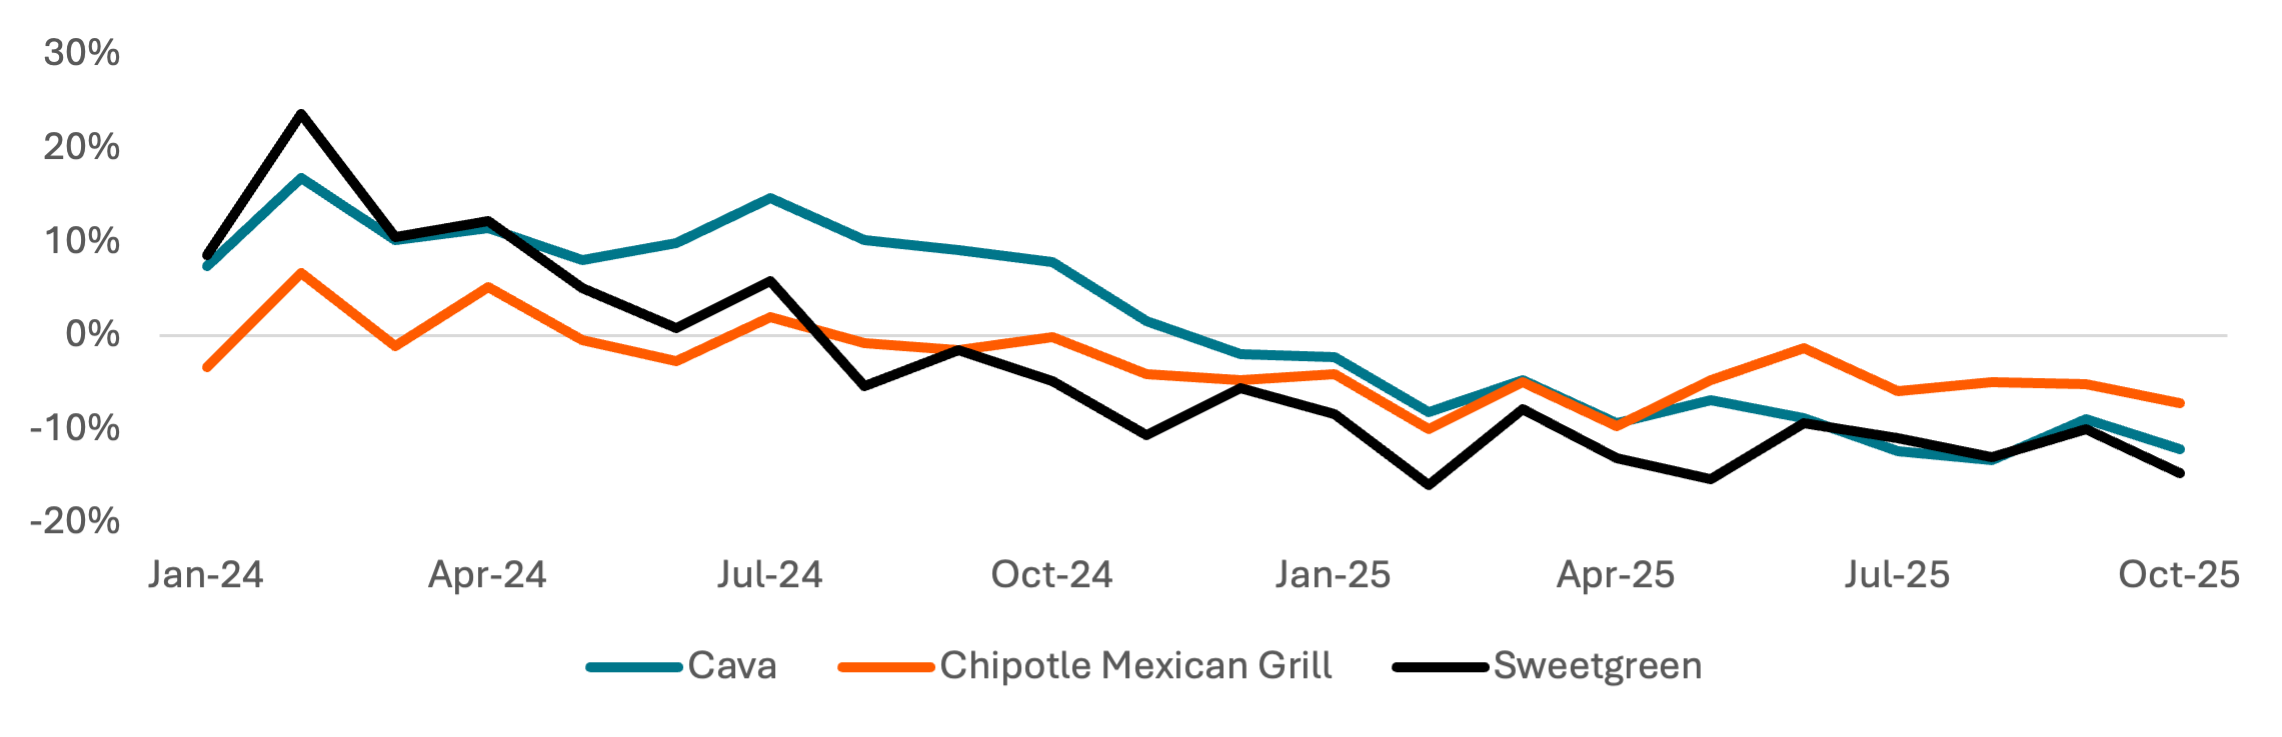
Bowl-based Fast Casual brands Cava and Sweetgreen have seen transaction value growth outpace the QSR categories and Fast Casual categories over the past 6 quarters. Sweetgreen grew transaction value ~10% Y/Y in 2023-2024 but trails both Cava and Chipotle in transaction growth. All three platforms saw spend decelerate in October, though Chipotle’s inflection was more modest.
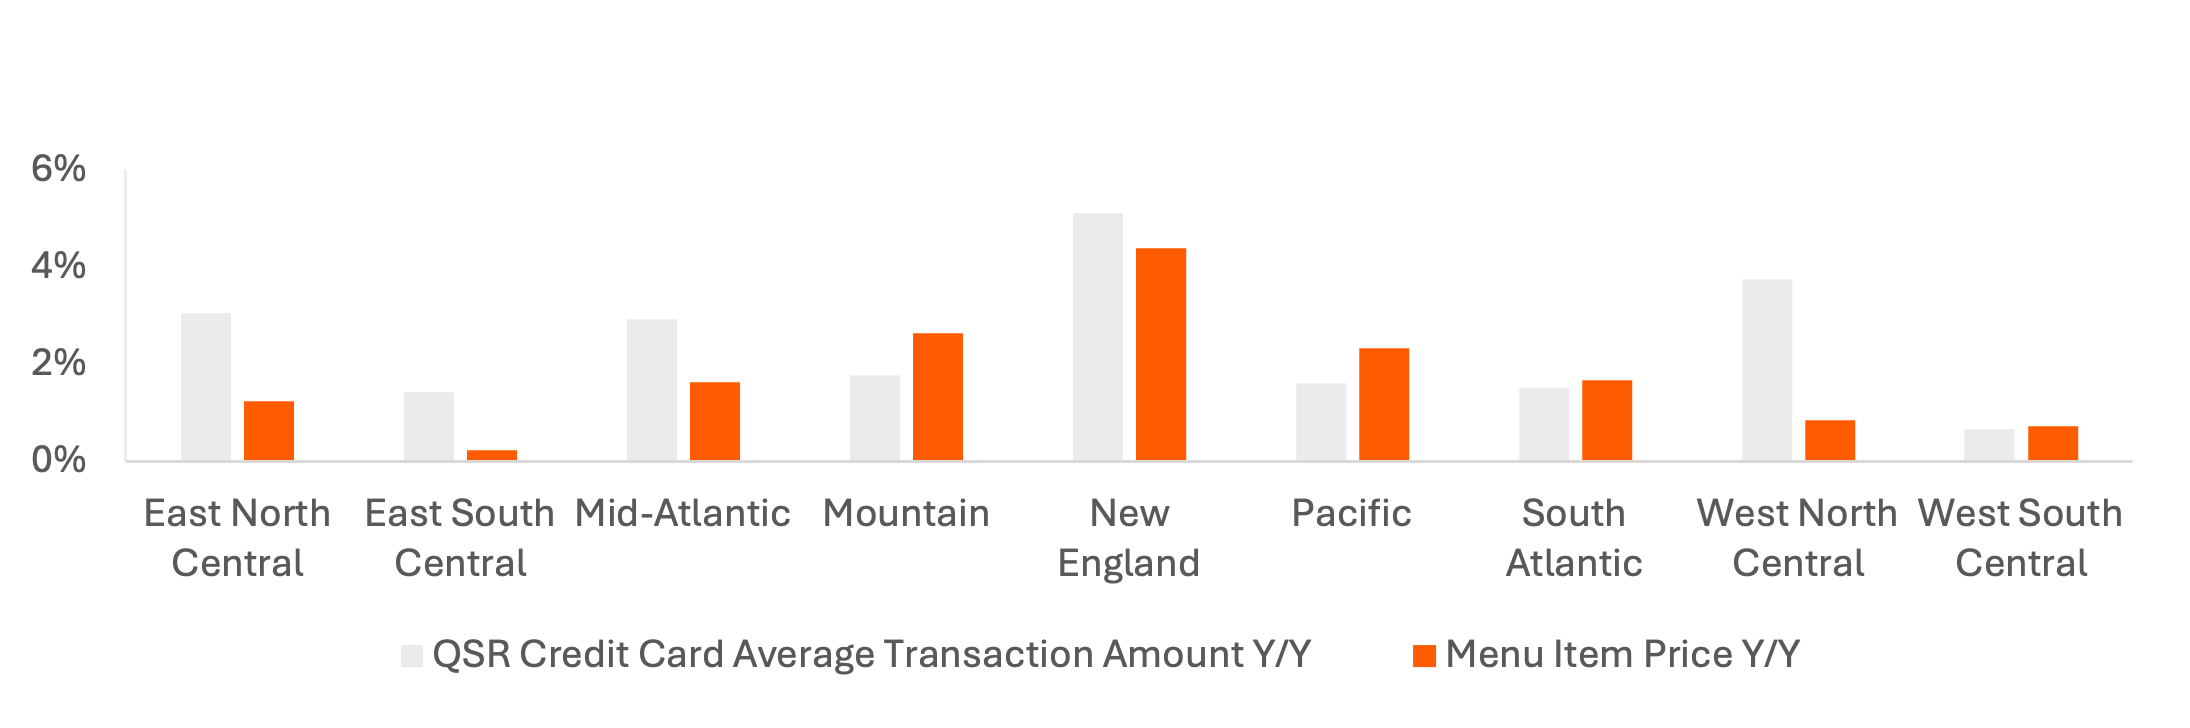
In 3Q25, item prices and transaction values both grew the most Y/Y in New England. After New England, item prices grew the most in the Mountain and Pacific census regions, and the least in the Central regions. Transaction amount growth heavily outgrew menu price increases in three of the Central regions.
Exhibit 5: Average Restaurant Item Price Y/Y Increase
Price: Requires row-level bulk data access, available on request
Exhibit 6: Card Average Transaction Amount Y/Y Growth by Restaurant Category
Price: 76.8 Tokens
Exhibit 7: Card Average Transaction Amount Y/Y Growth, Fast Casual “Slop” Ecosystem
Price: 85.2 Tokens
Exhibit 8: 3Q25 Average Restaurant Item Price Y/Y Increase vs. QSR Spend per Transaction Y/Y Growth, by Census Region
Price: Requires row-level bulk data access, available on request
Alcohol Inflation
Unlike with overall grocery inflation, alcohol prices grew more modestly in 2022-2023, and consumers maintained their spend against those post-pandemic price increases. However, consumer spend per item has fallen Y/Y in each of the last 5 months to a post-pandemic low of -2.0% Y/Y in October. In the last 2 months, alcohol prices have been growing 3% faster Y/Y than spend per item.
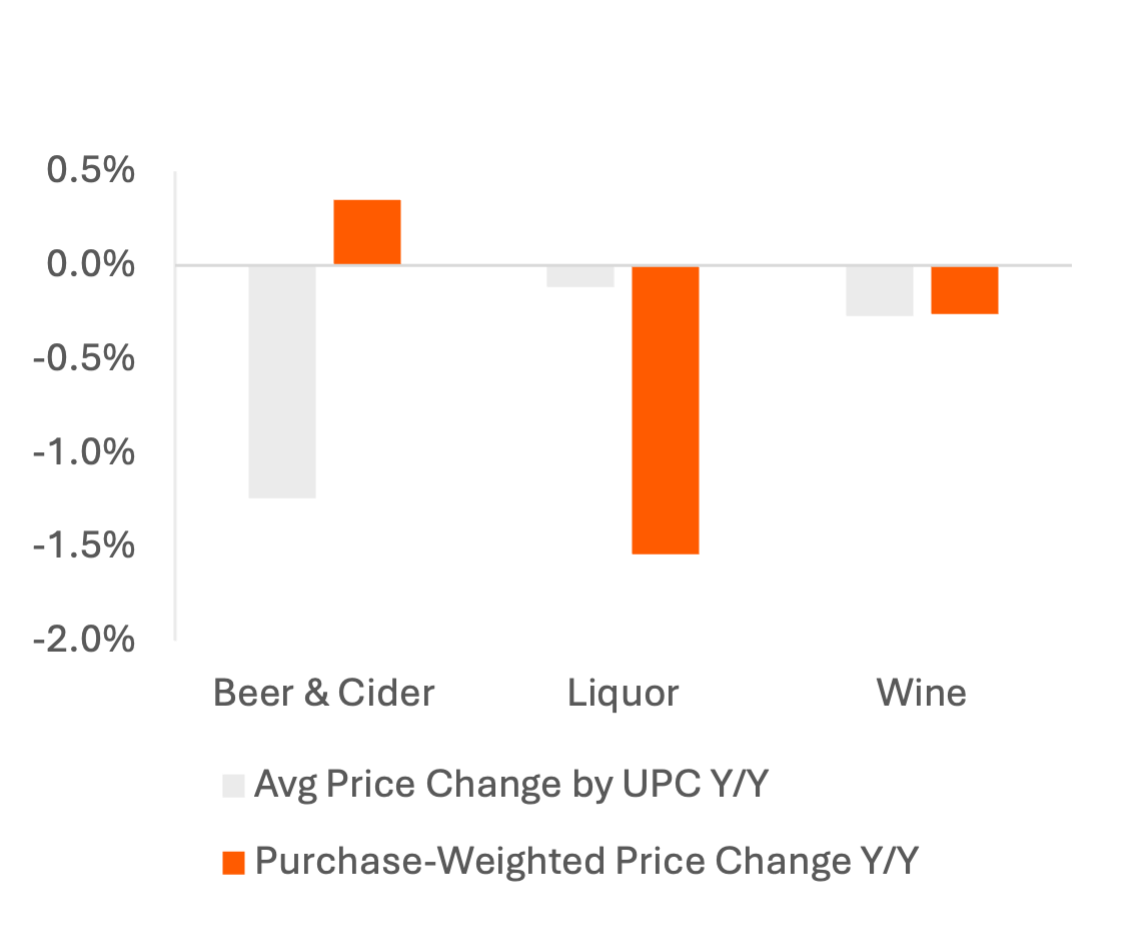
Prices are still down on average Y/Y in 2025, with beer & cider prices falling the most and liquor prices ~flat, which may reflect tariff impacts as wine and liquor are more likely to be imported, and bottled beer from Mexico is tariff-exempt via the USMCA. Consumers are still buying more expensive beers or larger pack sizes but cutting back within liquor purchases, possibly trading down to smaller bottles.
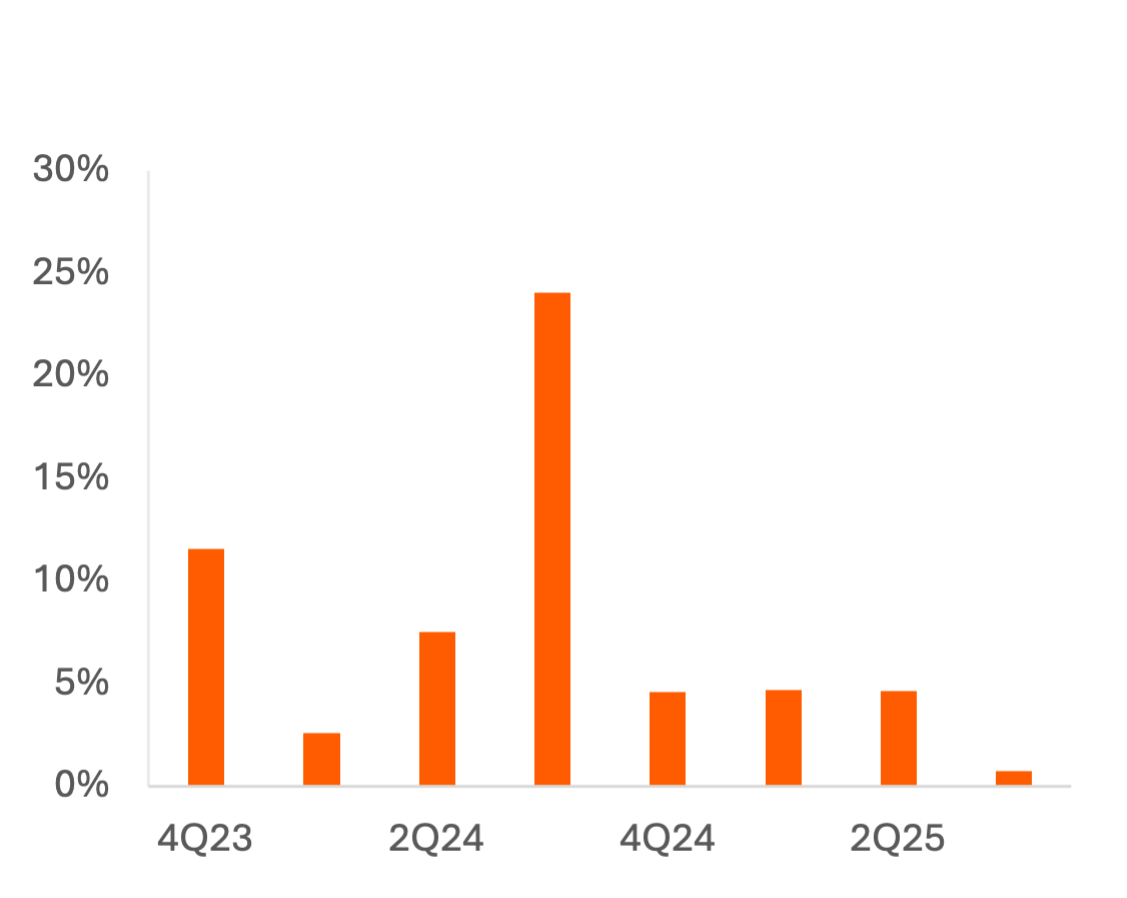
At restaurants, alcohol prices increased significantly from 4Q23 – 3Q24 and are growing at a similar pace to restaurant food in 2025, with 5% Y/Y growth in 1H25 decelerating to just 1% Y/Y in 3Q.
Exhibit 9: Y/Y Change in Avg Supermarket Price of Alcohol by UPC vs. Avg Price of Purchased Units
Price: Requires row-level bulk data access, available on request
Exhibits 10-11: 2024 Y/Y Change in Avg Price by UPC Code vs. Avg Price of Purchased Units, by Category
Exhibit 10: 2024
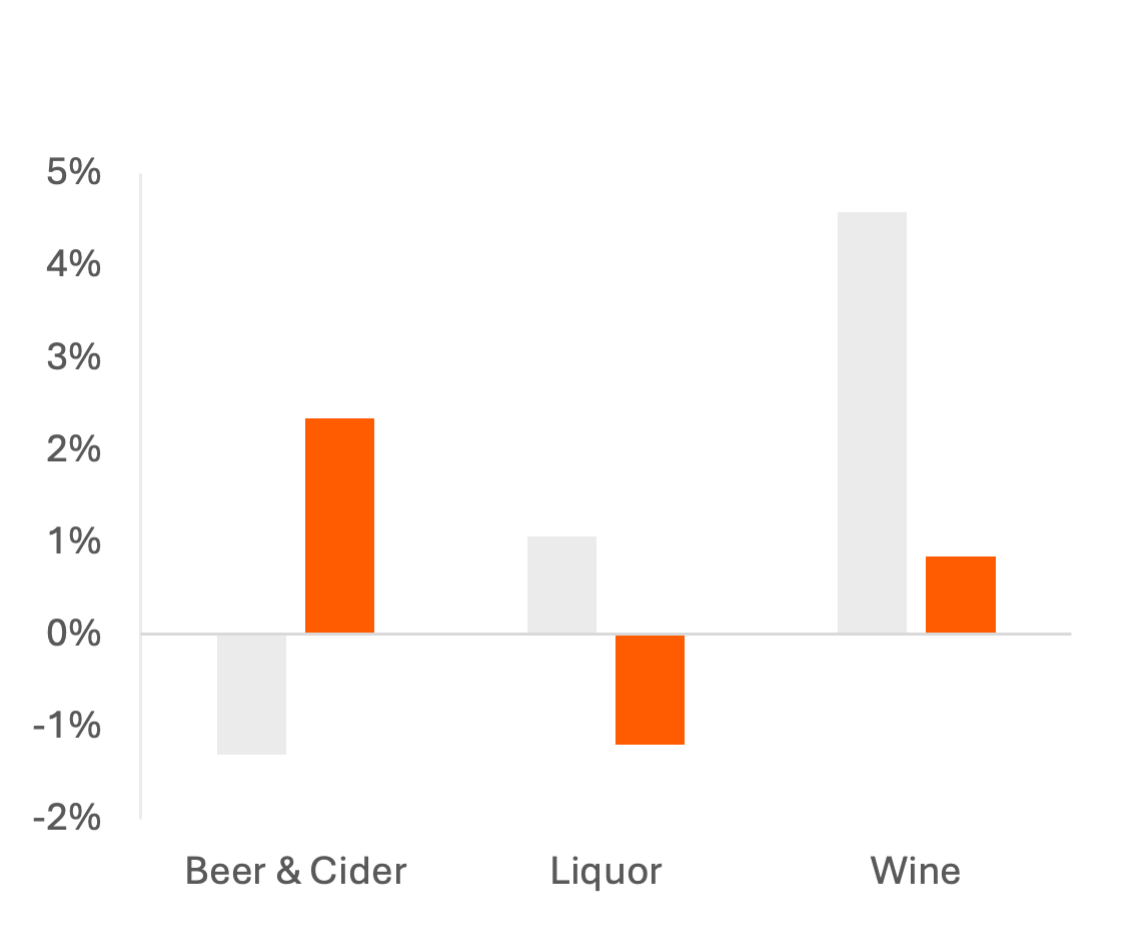
Exhibit 11: 2025
Price: Requires row-level bulk data access, available on request
Exhibit 12: Average Restaurant Alcoholic Item Price Y/Y Increase
Price: Requires row-level bulk data access, available on request
Income Demographics and Spend
Per-item spend has increased consistently on a year-over-year basis at mass merchandisers and convenience stores, with growth rates falling the most in early 2024 before accelerating again in late 2024 and 2025.
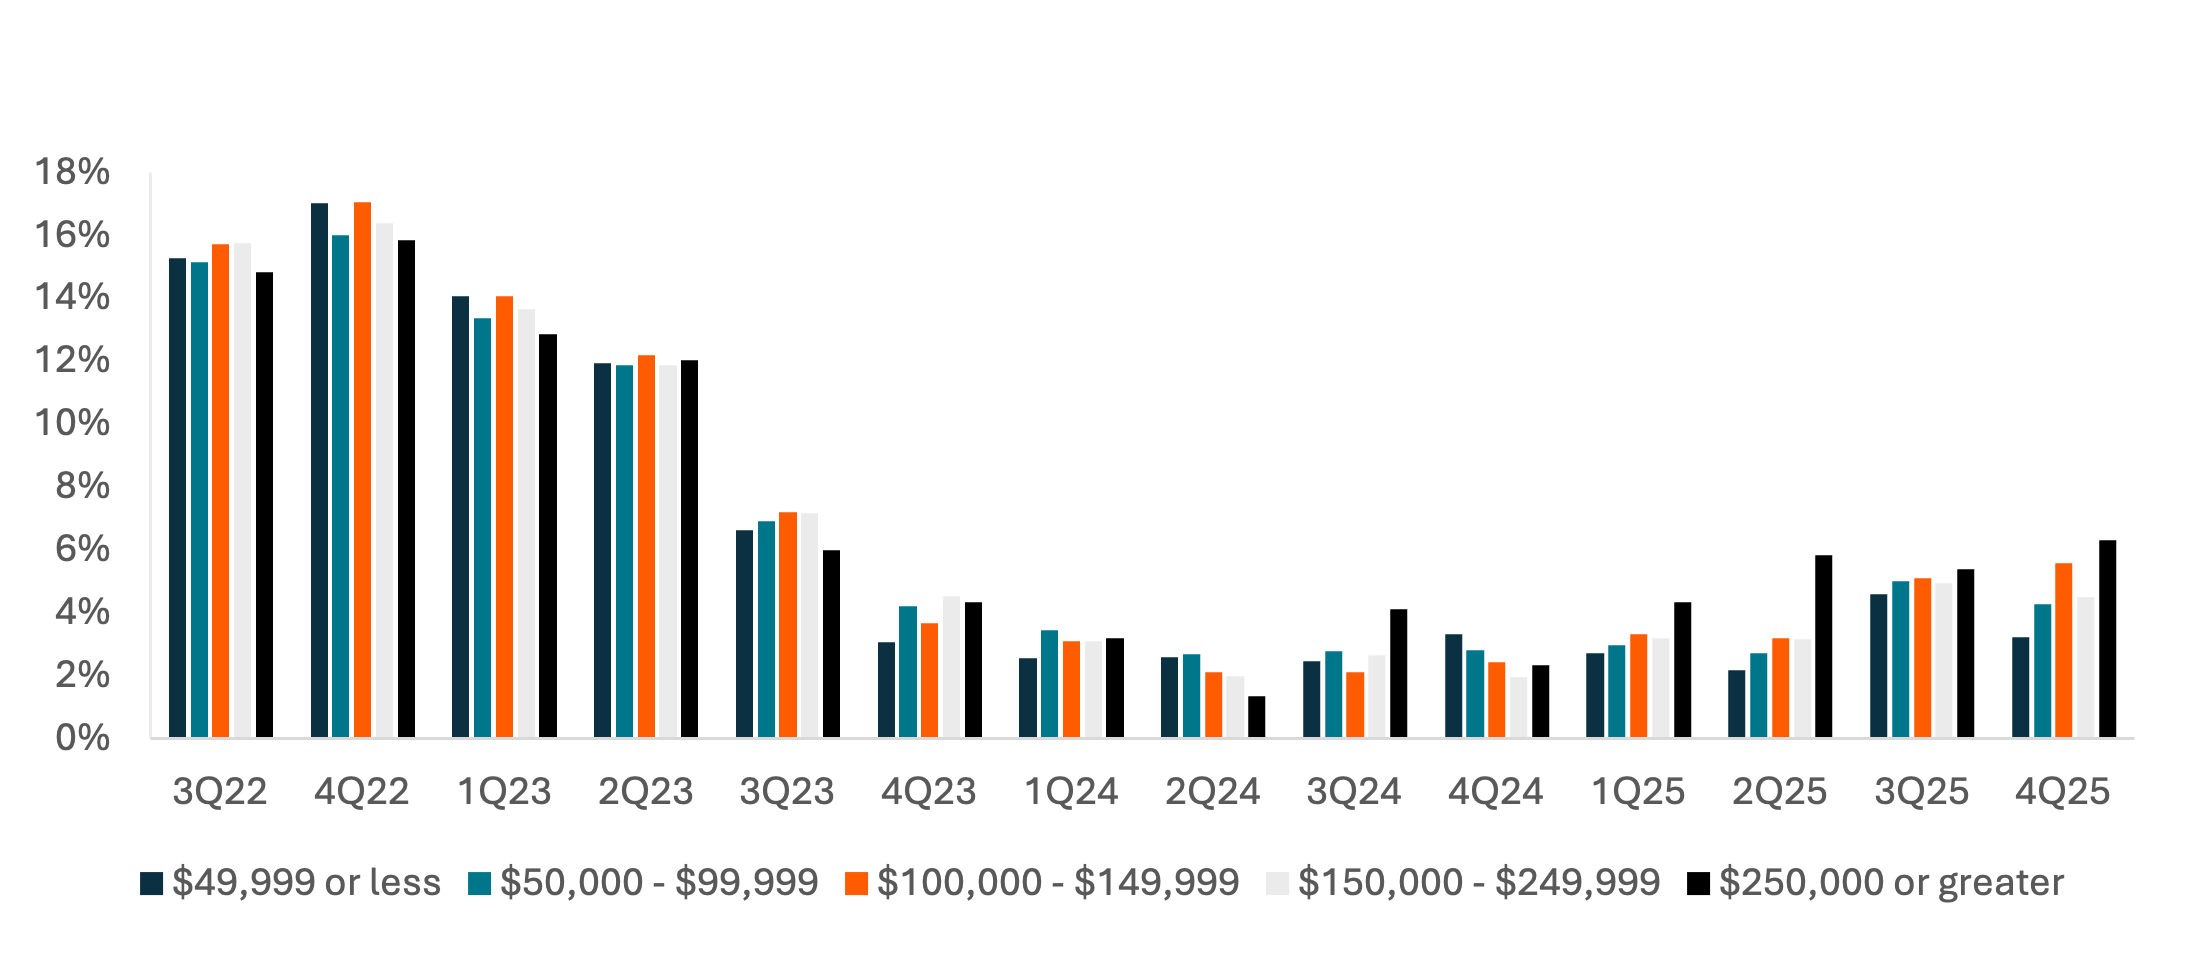
Income cohorts at mass merchandisers suggest an emergence of “K-shaped” economic trends starting around 3Q24, as spend per item growth has been greater for the highest income cohort than for any other income cohort in 5 of the 6 quarters since. During earlier quarters when inflation was more prevalent, the highest-income cohort was increasing per-item spend the least, suggesting a greater usage of trade-downs. While the lowest-income cohort kept pace with other groups during 2023, perhaps due to wage increases during the pandemic, that cohort began to show greater weakness in 4Q23 and continues to increase per-item send at a slow rate.
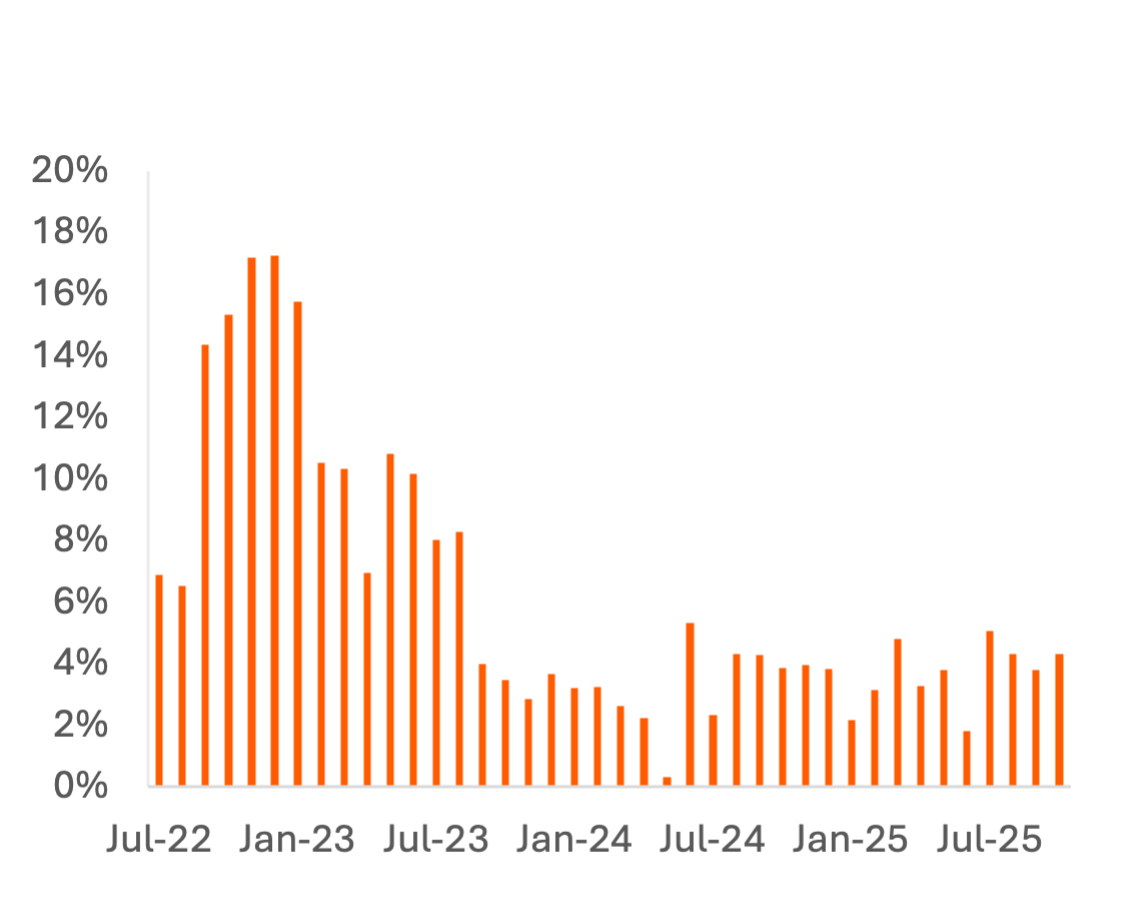
At convenience stores, EBT users have increased per-item spend every quarter, despite users of traditional payment methods displaying very little spend growth in recent quarters. This could indicate fewer trade-down options in frequent EBT spending categories like prepared and frozen foods, or that the 3.8% rise in maximum EBT benefits outpaced average wage growth (~3% at SMBs in 2025, per a recent Carbon Arc report).
Exhibit 13: Food, Beverage, and Tobacco Per-Item Spend Y/Y Growth at Mass Merchandisers
Price: 202 Tokens
Exhibit 14: Food, Beverage, and Tobacco Per-Item EBT vs. non-EBT Spend Y/Y Growth at Convenience Stores
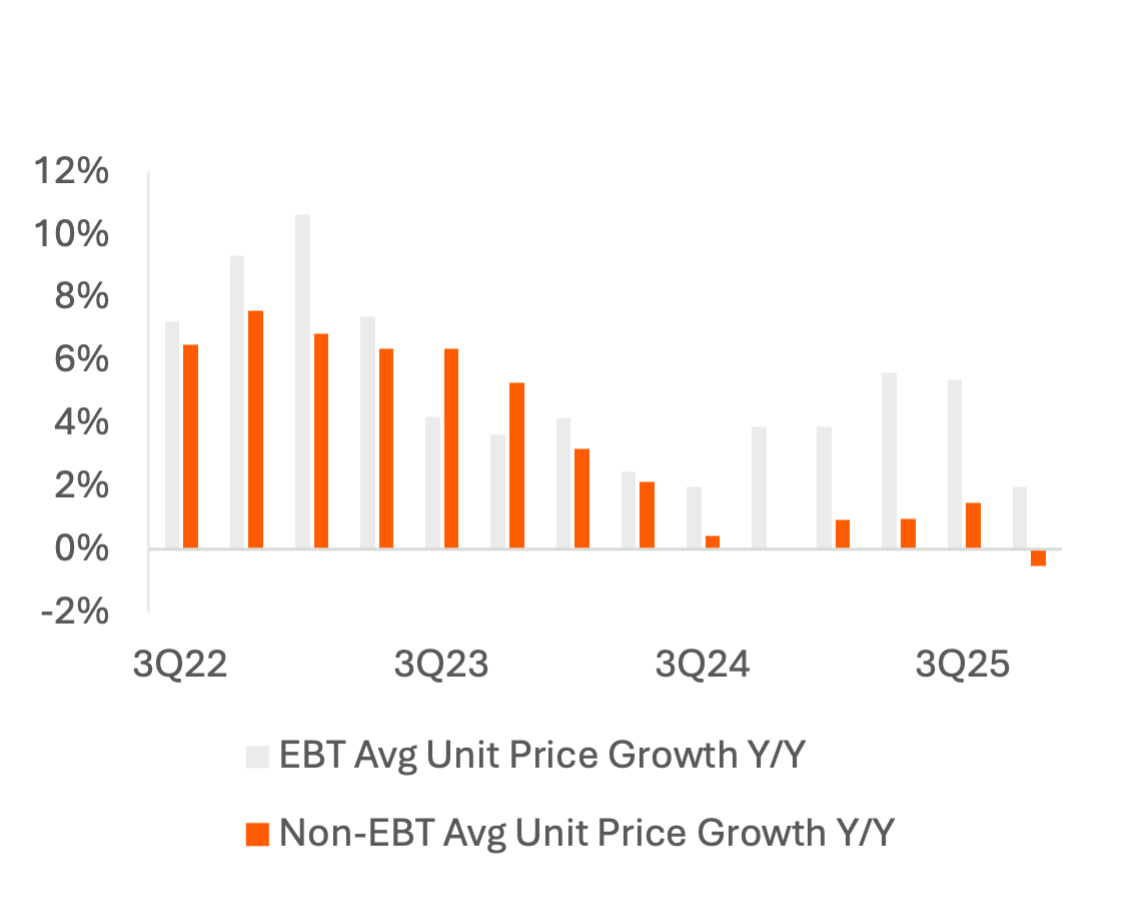
Price: 125.04 Tokens
Exhibit 15: Food, Beverage, and Tobacco Per-Item Spend Y/Y Growth at Mass Merchandisers by Income Cohort
Price: 1054.72 Tokens
Additional Category Inflation Insights
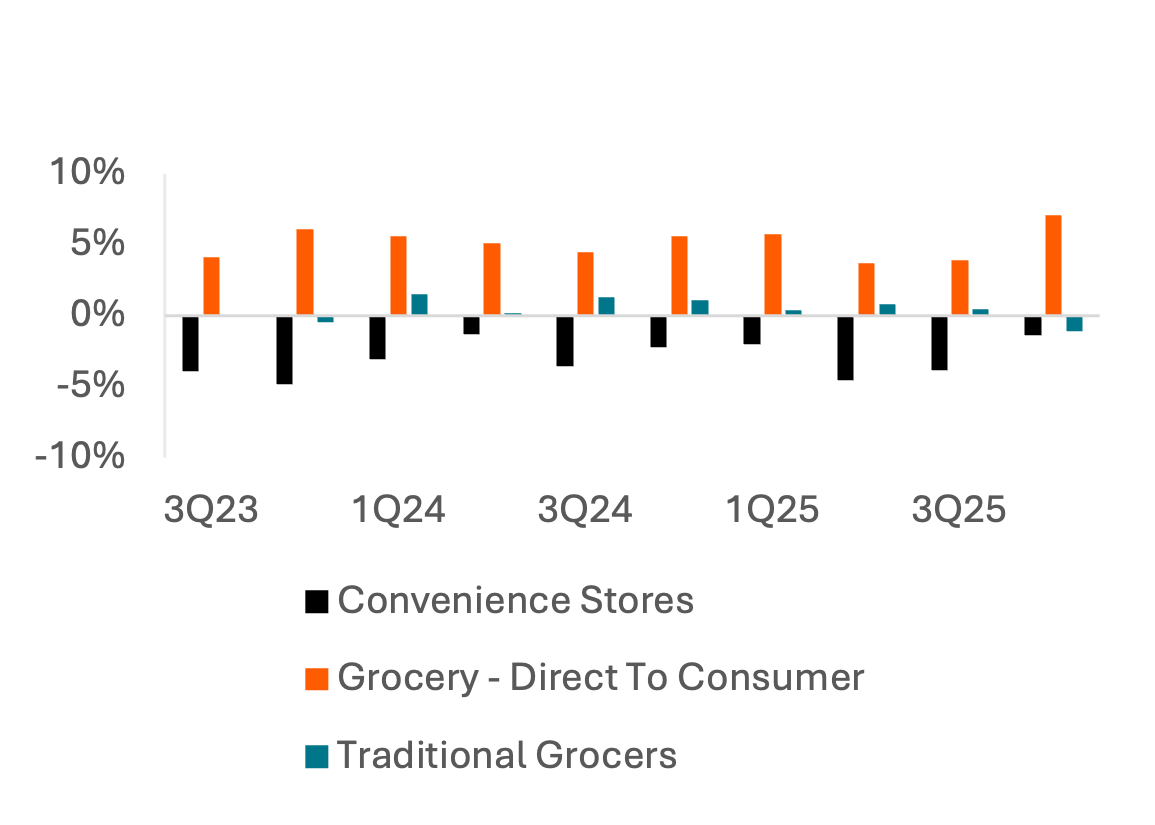
Even as per-item spend increased in 2023 and into 2024 and 2025, consumer card spend growth stayed ~flat to negative Y/Y at convenience stores and traditional grocers. Card spend per transaction levels for DTC grocery have grown at a consistent ~7% rate, suggesting time-saving activities are more insulated from trade-downs in transaction value.
Additional in-store category spend insights continue to highlight the significant increases in prices and per-item spend on soft drinks & sodas. Consumers in the POS – Instore mass merchandiser panel show greater strength in purchasing meats but are comparatively weaker in spending on Dairy & Eggs. Those trends are reversed among convenience store consumers, suggesting diverging trends between those customer profiles.
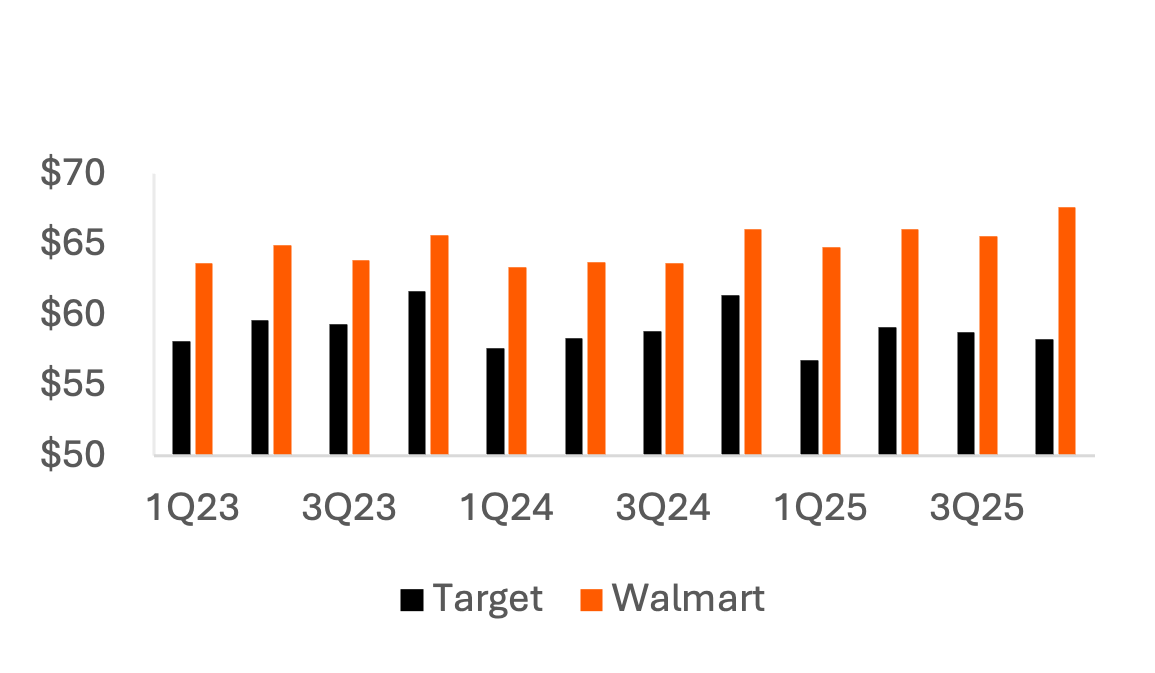
Card spend at mass merchandisers shows that despite continued per-item spend growth, consumers are not spending more on trips to Target, but average transaction value at Walmart is increasing 2-3%, suggesting its shoppers are more willing to maintain a full cart despite rising prices.
Exhibit 16: Y/Y Change in Average Card Transaction Value by Category
Price: 49.12 Tokens
Exhibit 17: Average Card Transaction Value
Price: 45.12 Tokens
Exhibit 18: Category Per-Item Spend Y/Y Growth at Mass Merchandisers
Price: 256.9 Tokens
Exhibit 19: Category Per-Item Spend Y/Y Growth at Convenience Stores
Price: 312.8 Tokens
Imports and Tariff Impact
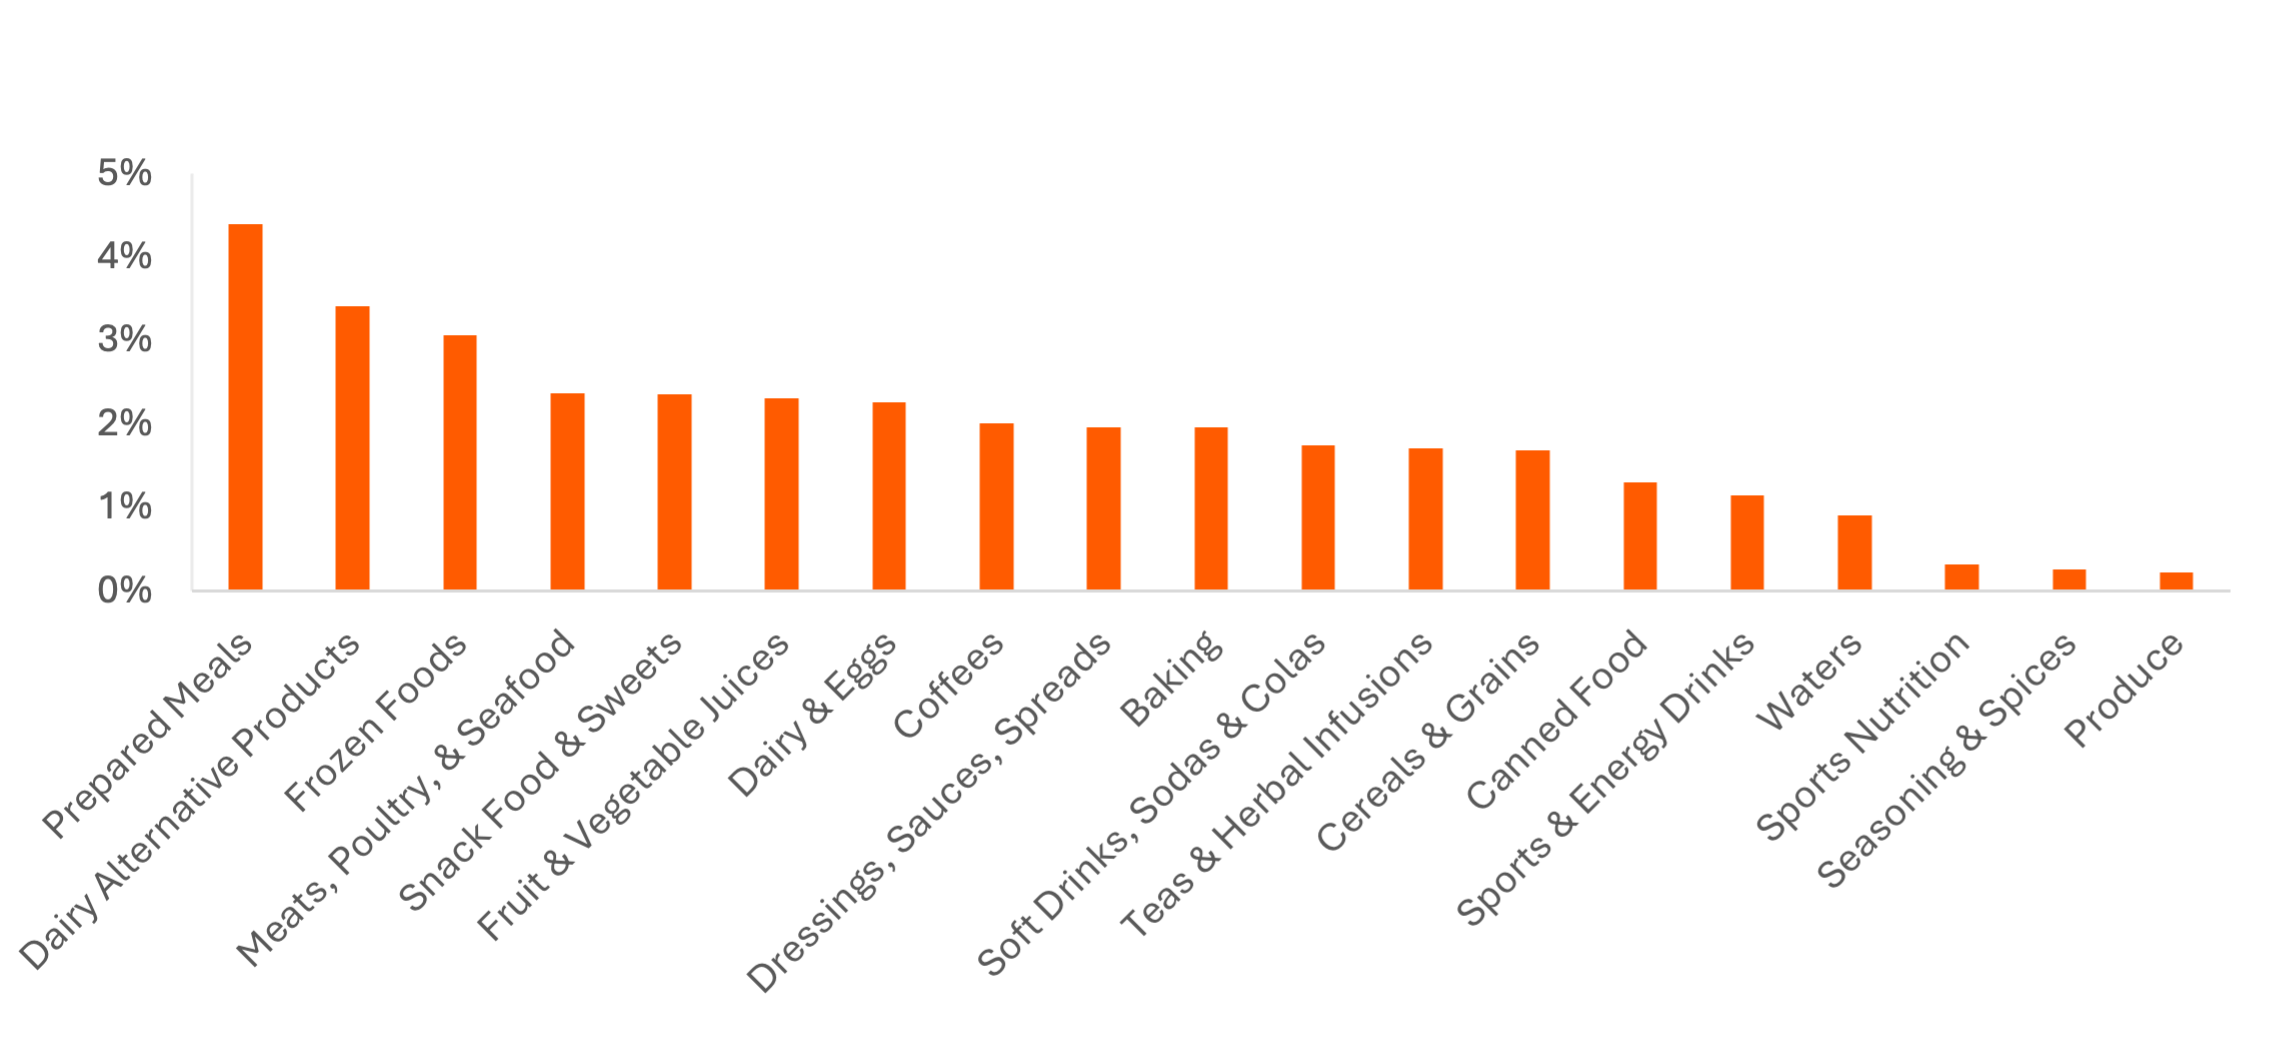
Import values for many key food categories grew significantly Y/Y in 4Q24 but decelerated sharply in June 2025 ahead of the effective date for “reciprocal” tariffs imposed on all imports from specific countries, including India, the European Union, and Vietnam.
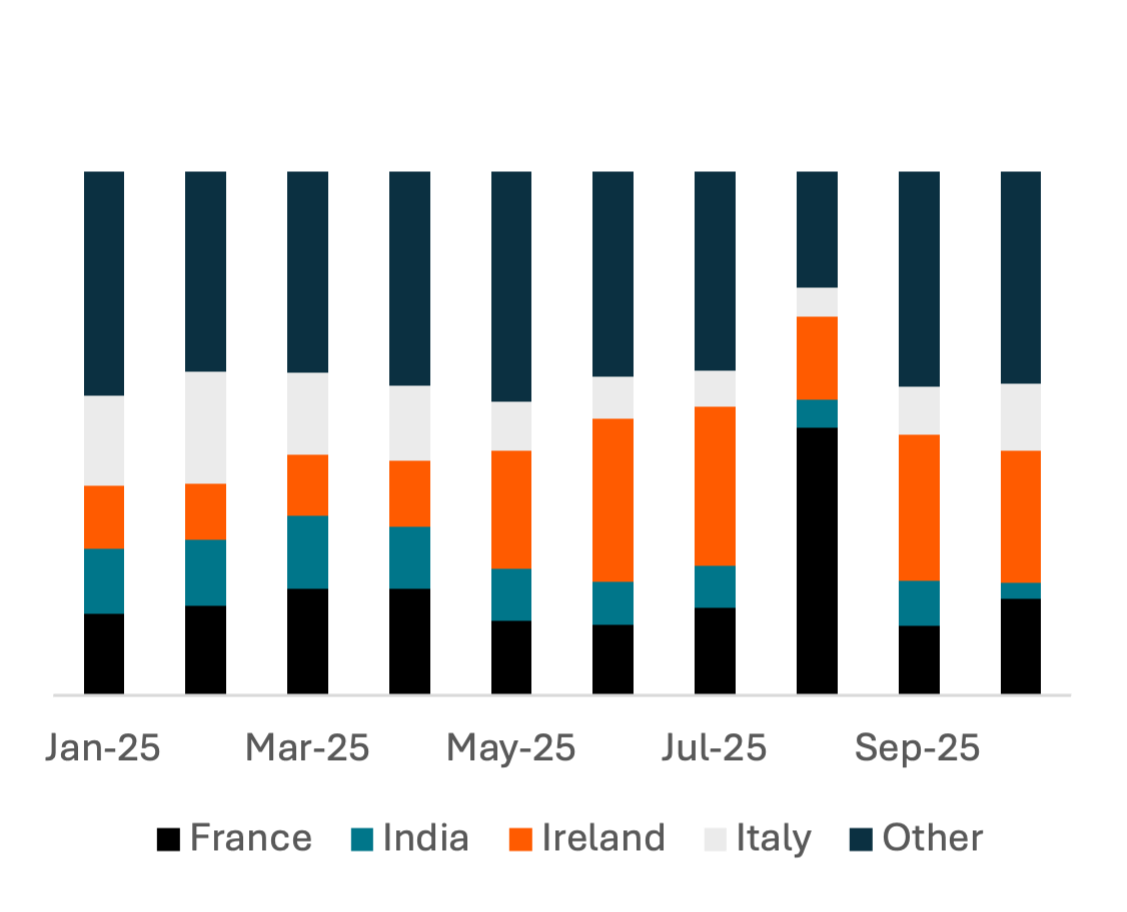
Dairy imports primarily come from the EU and India (90% of Indian imports are honey, which is included in the same HS category). The share of imports from India has shrunk in the last 3 months, suggesting a possibility that rising tariffs are redirecting supply chains in honey. Imports from the EU have been relatively consistent, which could reflect a premium product high-end consumers are still willing to pay for or a greater monopoly on supply chains in categories like cheese.
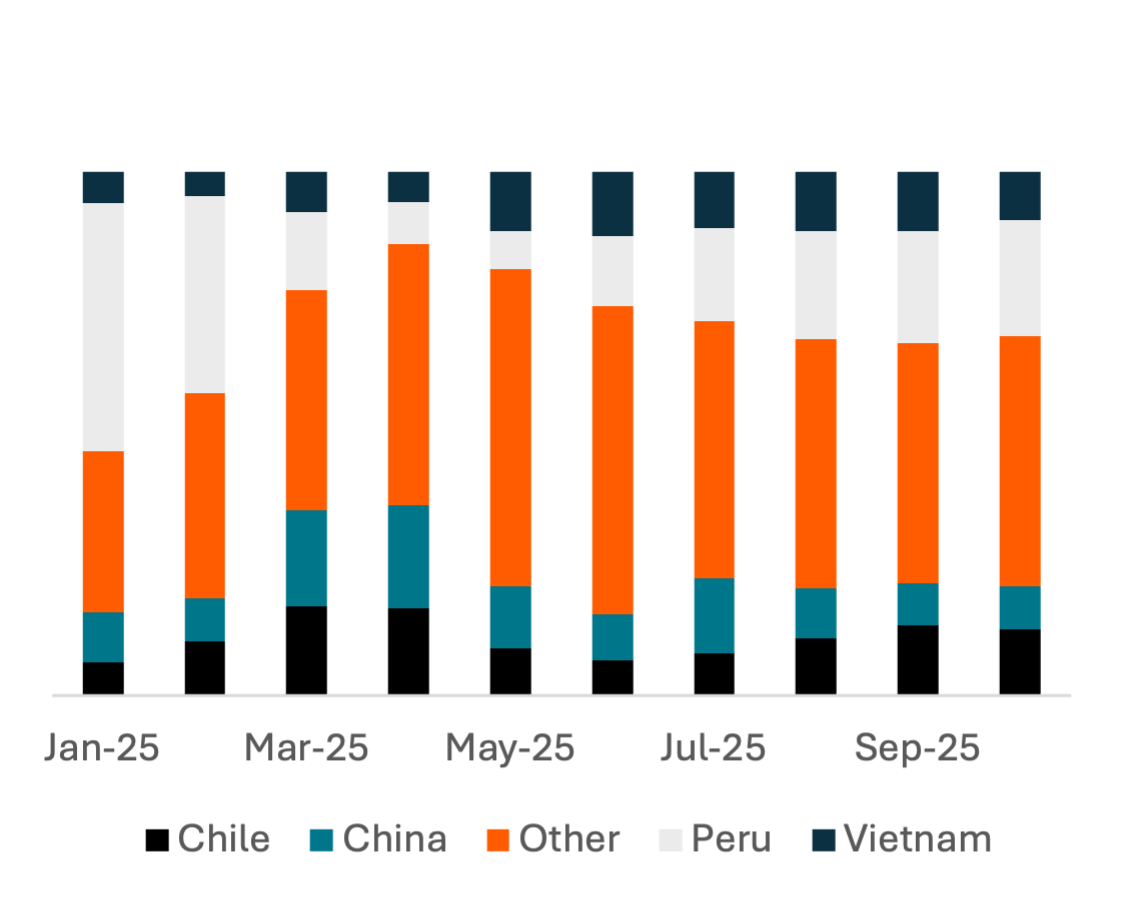
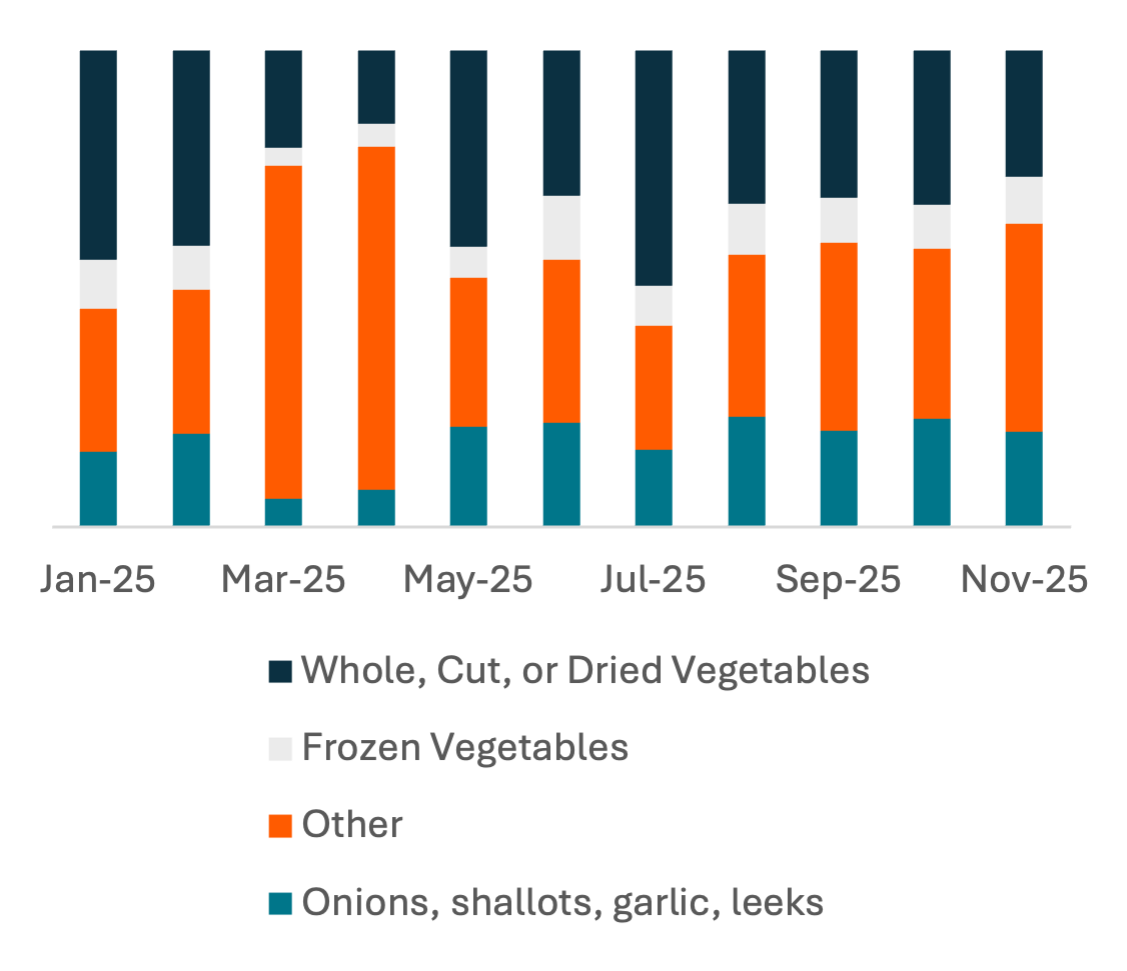
In produce, the supply chain is heavily distributed, but China is one of the largest sources of goods, primarily fresh or frozen vegetables rather than fruit. The share of produce imports from China and Vietnam rose in the period around Liberation Day and has stayed above the levels seen in January/February, suggesting tariffs may be directly impacting profitability and pricing rather than rerouting supply chains.
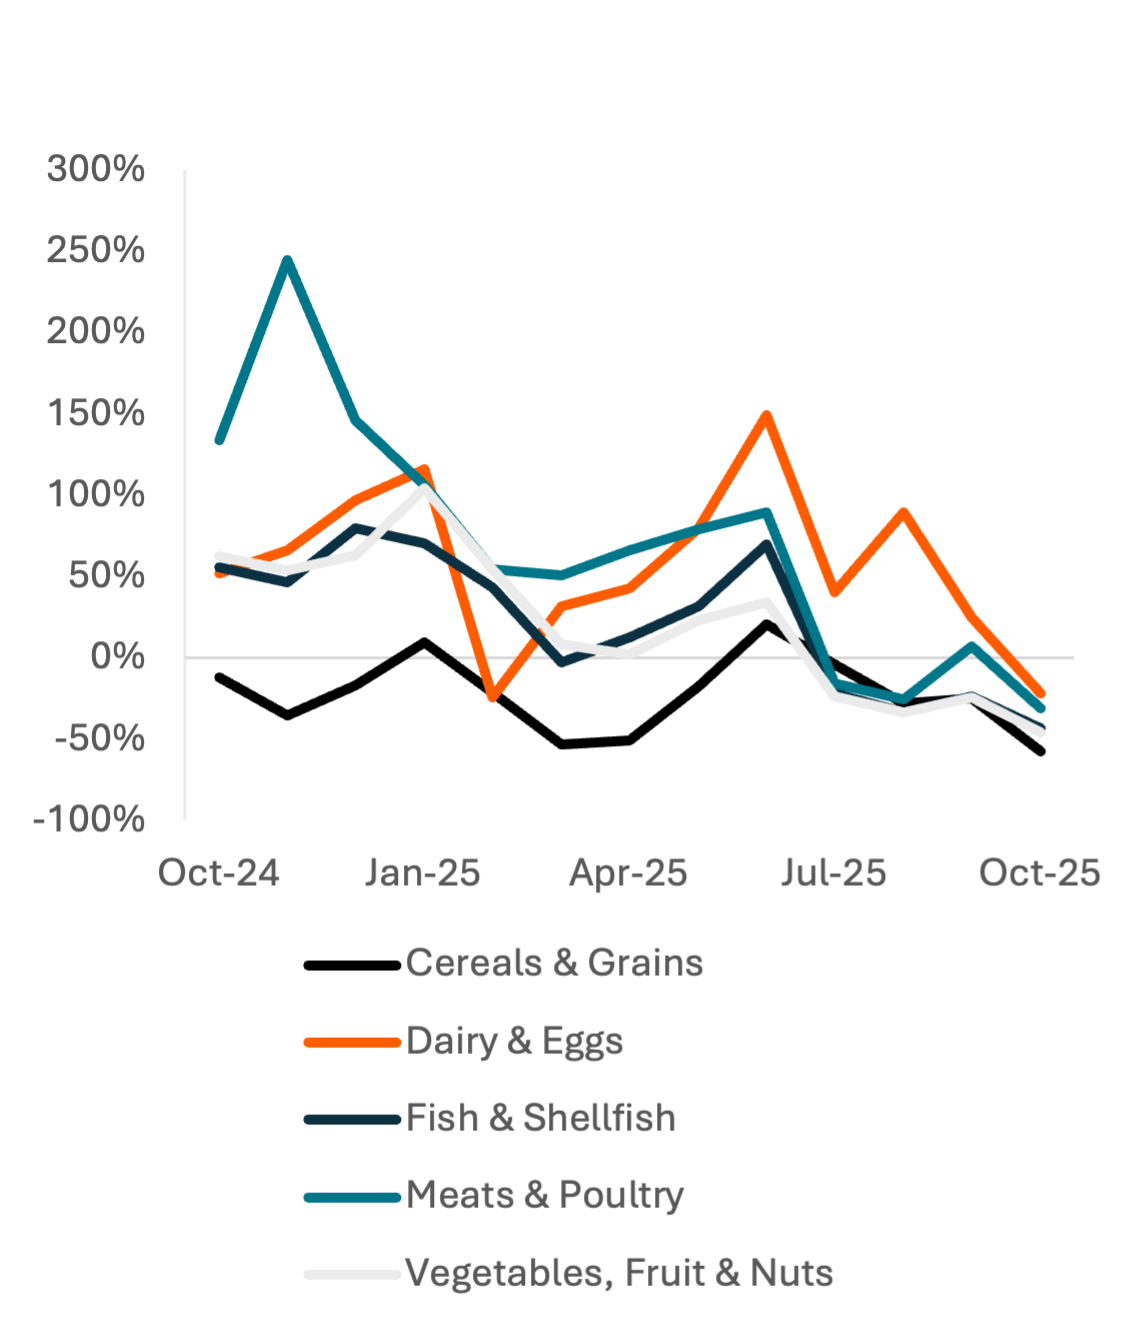
Exhibit 20: Y/Y Change in Total U.S. Maritime Import Value by HS Category
Price: 6223.22 Tokens
Exhibit 21: Exporting Country Share of U.S. Dairy & Eggs Maritime Imports
Price: 244.96 Tokens
Exhibit 22: Exporting Country Share of U.S. Vegetables, Fruit & Nuts Maritime Imports
Price: 1015.13 Tokens
Exhibit 23: HS Code Share of U.S. Produce Imports from China
Price: 123.21 Tokens
Appendix
Exhibit 24: 2025 EBT Share of Spend at Convenience Stores by Category
Price: 1188.64 Tokens
Exhibit 25: Y/Y Credit Card Number of Transactions Growth by Dining Category
Price: 9.82 Tokens
Exhibit 26: Y/Y Credit Card Number of Transactions Growth, Fast Casual “Slop” Ecosystem
Price: 7.49 Tokens
References
-
The Wall Street Journal. “Inflation Isn’t as Bad as Economists Thought, but Americans Still Hate It.” The Wall Street Journal, October 24, 2025. https://www.wsj.com/economy/consumers/inflation-isnt-as-bad-as-economists-thought-but-americans-still-hate-it-34ec9494
-
The Wall Street Journal. “It’s Been 30 Years Since Food Ate Up This Much of Your Income.” The Wall Street Journal, February 21, 2024. https://www.wsj.com/economy/consumers/its-been-30-years-since-food-ate-up-this-much-of-your-income-2e3dd3ed
-
The Wall Street Journal. “Inflation Isn’t as Bad as Economists Thought, but Americans Still Hate It.” The Wall Street Journal, October 24, 2025.
-
Seeking Alpha. “Albertsons Companies, Inc. (ACI) Q2 2025 Earnings Call Transcript.” Seeking Alpha, October 14, 2025. https://www.seekingalpha.com/article/4829820-albertsons-companies-inc-aci-q2-2025-earnings-call-transcript
-
The Coca-Cola Company. “Form 10-K: Annual Report for the Year Ended December 31, 2023.” The Coca-Cola Company Investor Relations, accessed [date you accessed]. https://investors.coca-colacompany.com/filings-reports/all-sec-filings/content/0000021344-24-000009/ko-20231231.htm
-
The Coca-Cola Company. “Form 10-K: Annual Report for the Fiscal Year Ended December 31, 2024.” The Coca-Cola Company Investor Relations, accessed November 10, 2025, https://investors.coca-colacompany.com/filings-reports/all-sec-filings/content/0000021344-25-000011/ko-20241231.htm
Questions?
Contact us at support@carbonarc.co if you have any questions!
CARARC-20251111-INFLATION-0001