Economic Spotlight
Carbon Arc Datasets: SMB Workforce, Job Movements, Card – US Complete
Consumer Transaction Data Highlights a Struggling Economy Dating Back to 2023
September 15, 2025
Executive Summary
This summer, the Bureau of Labor Statistics released two1,2 major revisions indicating that U.S. employment grew much slower than anticipated in 2024 and 2025. On September 9, 2025, the Bureau of Labor Statistics released revised data showing the U.S. economy added ~850,000 jobs in the 12 months ending in March, cutting its prior estimate in half.
Consumer transaction data - such as payroll records - can offer a sharper lens on these labor and employment trends, capturing changes in the US workforce in real time and with deeper granularity by looking at role, leveling, location, and employer. Carbon Arc’s Job Movements and SMB Workforce data assets complement one another to reveal early signals of a cooling labor market.
Key Takeaways
-
Carbon Arc’s Job Movements data, which measures corporate employee movement, shows the workforce contracting since 2023, concentrated amongst entry-level staff and lower-level management, with senior positions still growing.
-
Workforce growth by category shows gains since 2021 have been concentrated in research & consulting firms, with retail categories showing some of the largest declines.
-
While Gen Z is steadily expanding its presence in the workforce, Millennial and Gen X employment has fallen 4% year-over-year.
-
San Diego, Seattle, and other west coast Core-Based Statistical Areas (CBSAs), urban nucleuses based on counties, are seeing the greatest employment declines. Most large cities experienced year-over-year employment declines in July 2025.
-
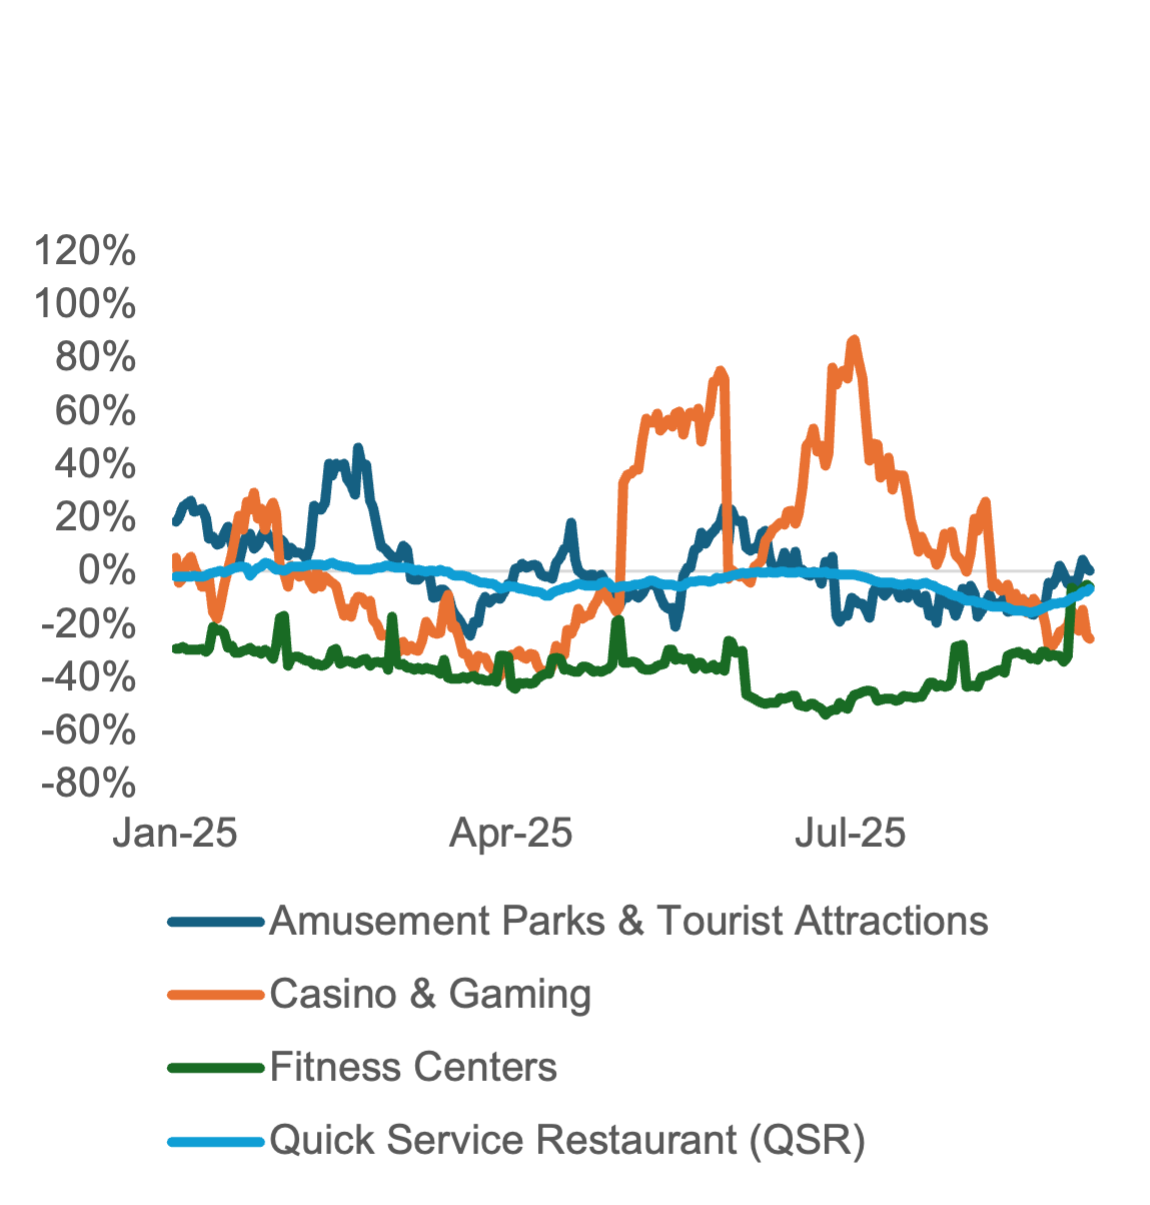
In San Diego, consumers are pulling back most on discretionary categories such as casino & gaming and spending at convenience stores.
-
Carbon Arc’s SMB Workforce data shows salary growth plateauing at roughly 3% year-over-year in late 2023—close to the rate of inflation—while workforce expansion has steadily slowed since the post-pandemic recovery.
Employment Trends by Function and Seniority
Carbon Arc’s Job Movements data shows employee growth first becoming negative in summer 2023. Apart from consulting, job losses have been widespread across employee functions. Specialized roles such as engineering, project management, information technology, and healthcare have experienced the smallest declines.
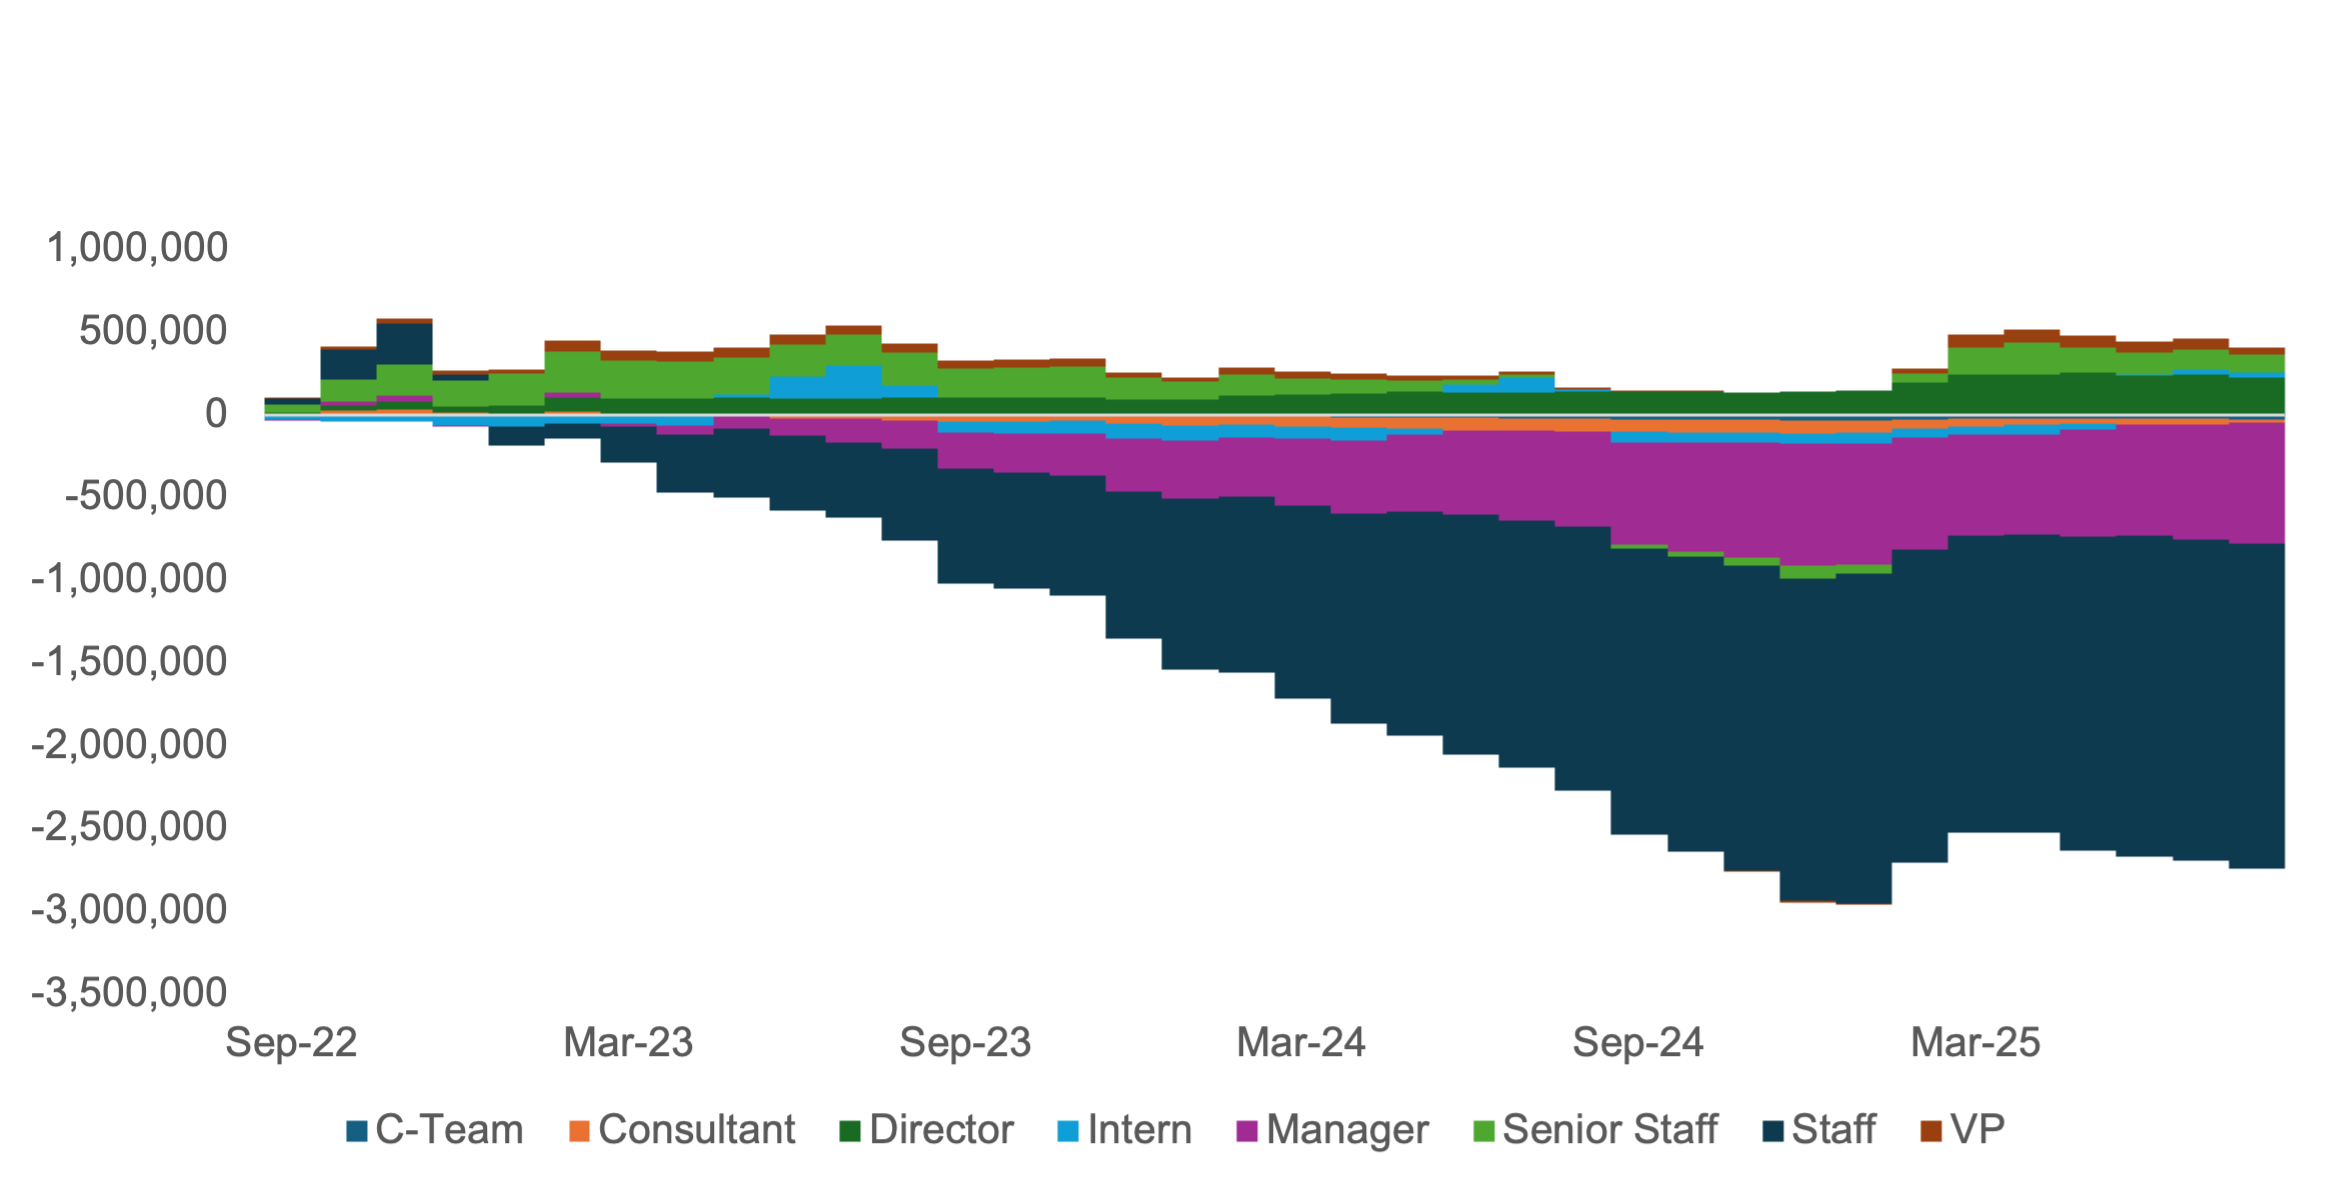
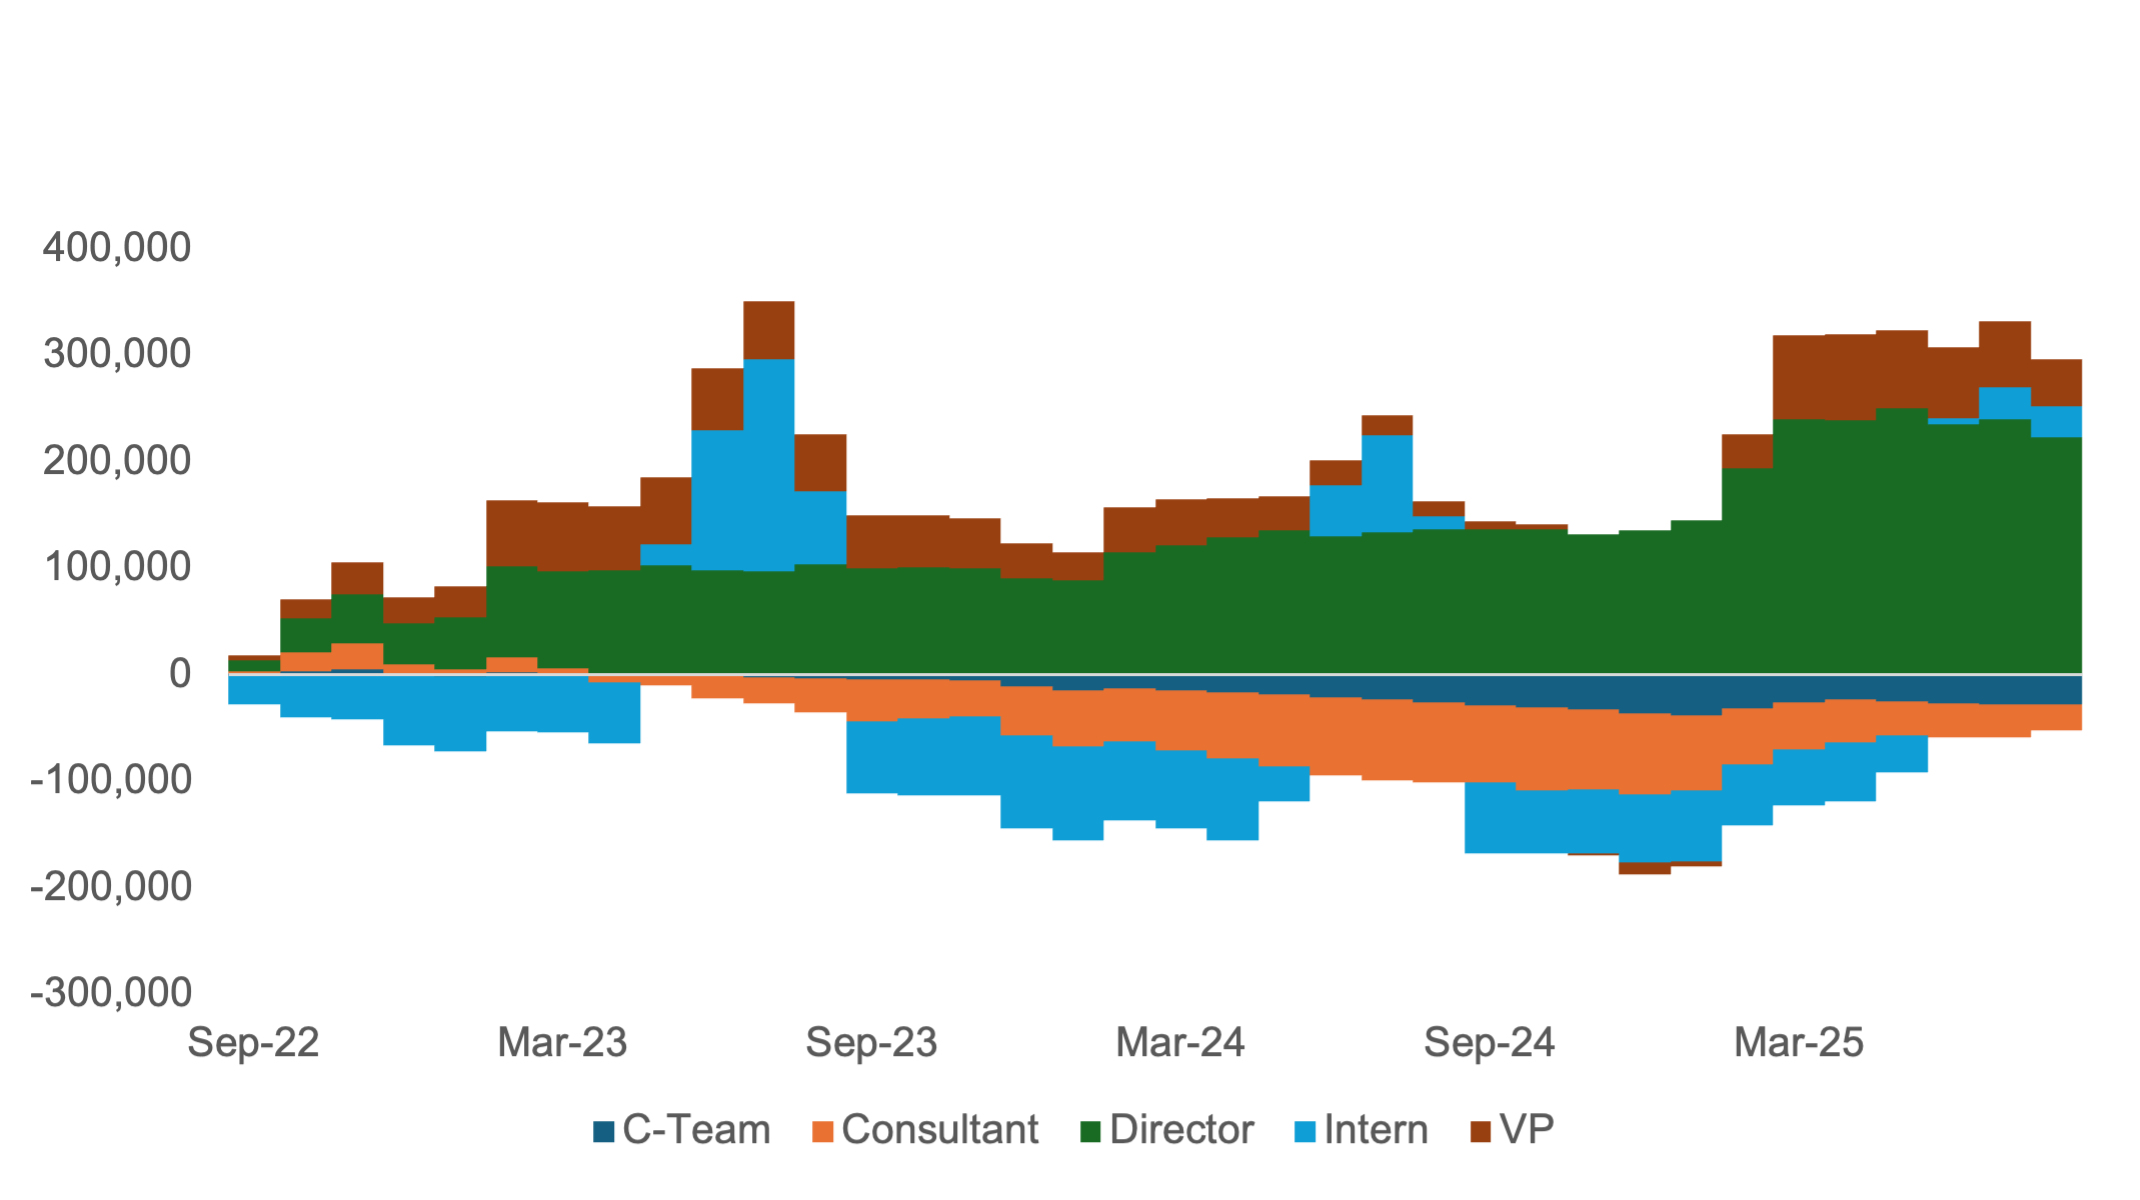
Losses are concentrated among Staff and Manager roles, while Senior Staff and Directors have been more insulated–suggesting companies are prioritizing retention of more senior talent focusing on experience and growth.
Exhibit 1: Cumulative Job Growth by Employee Function
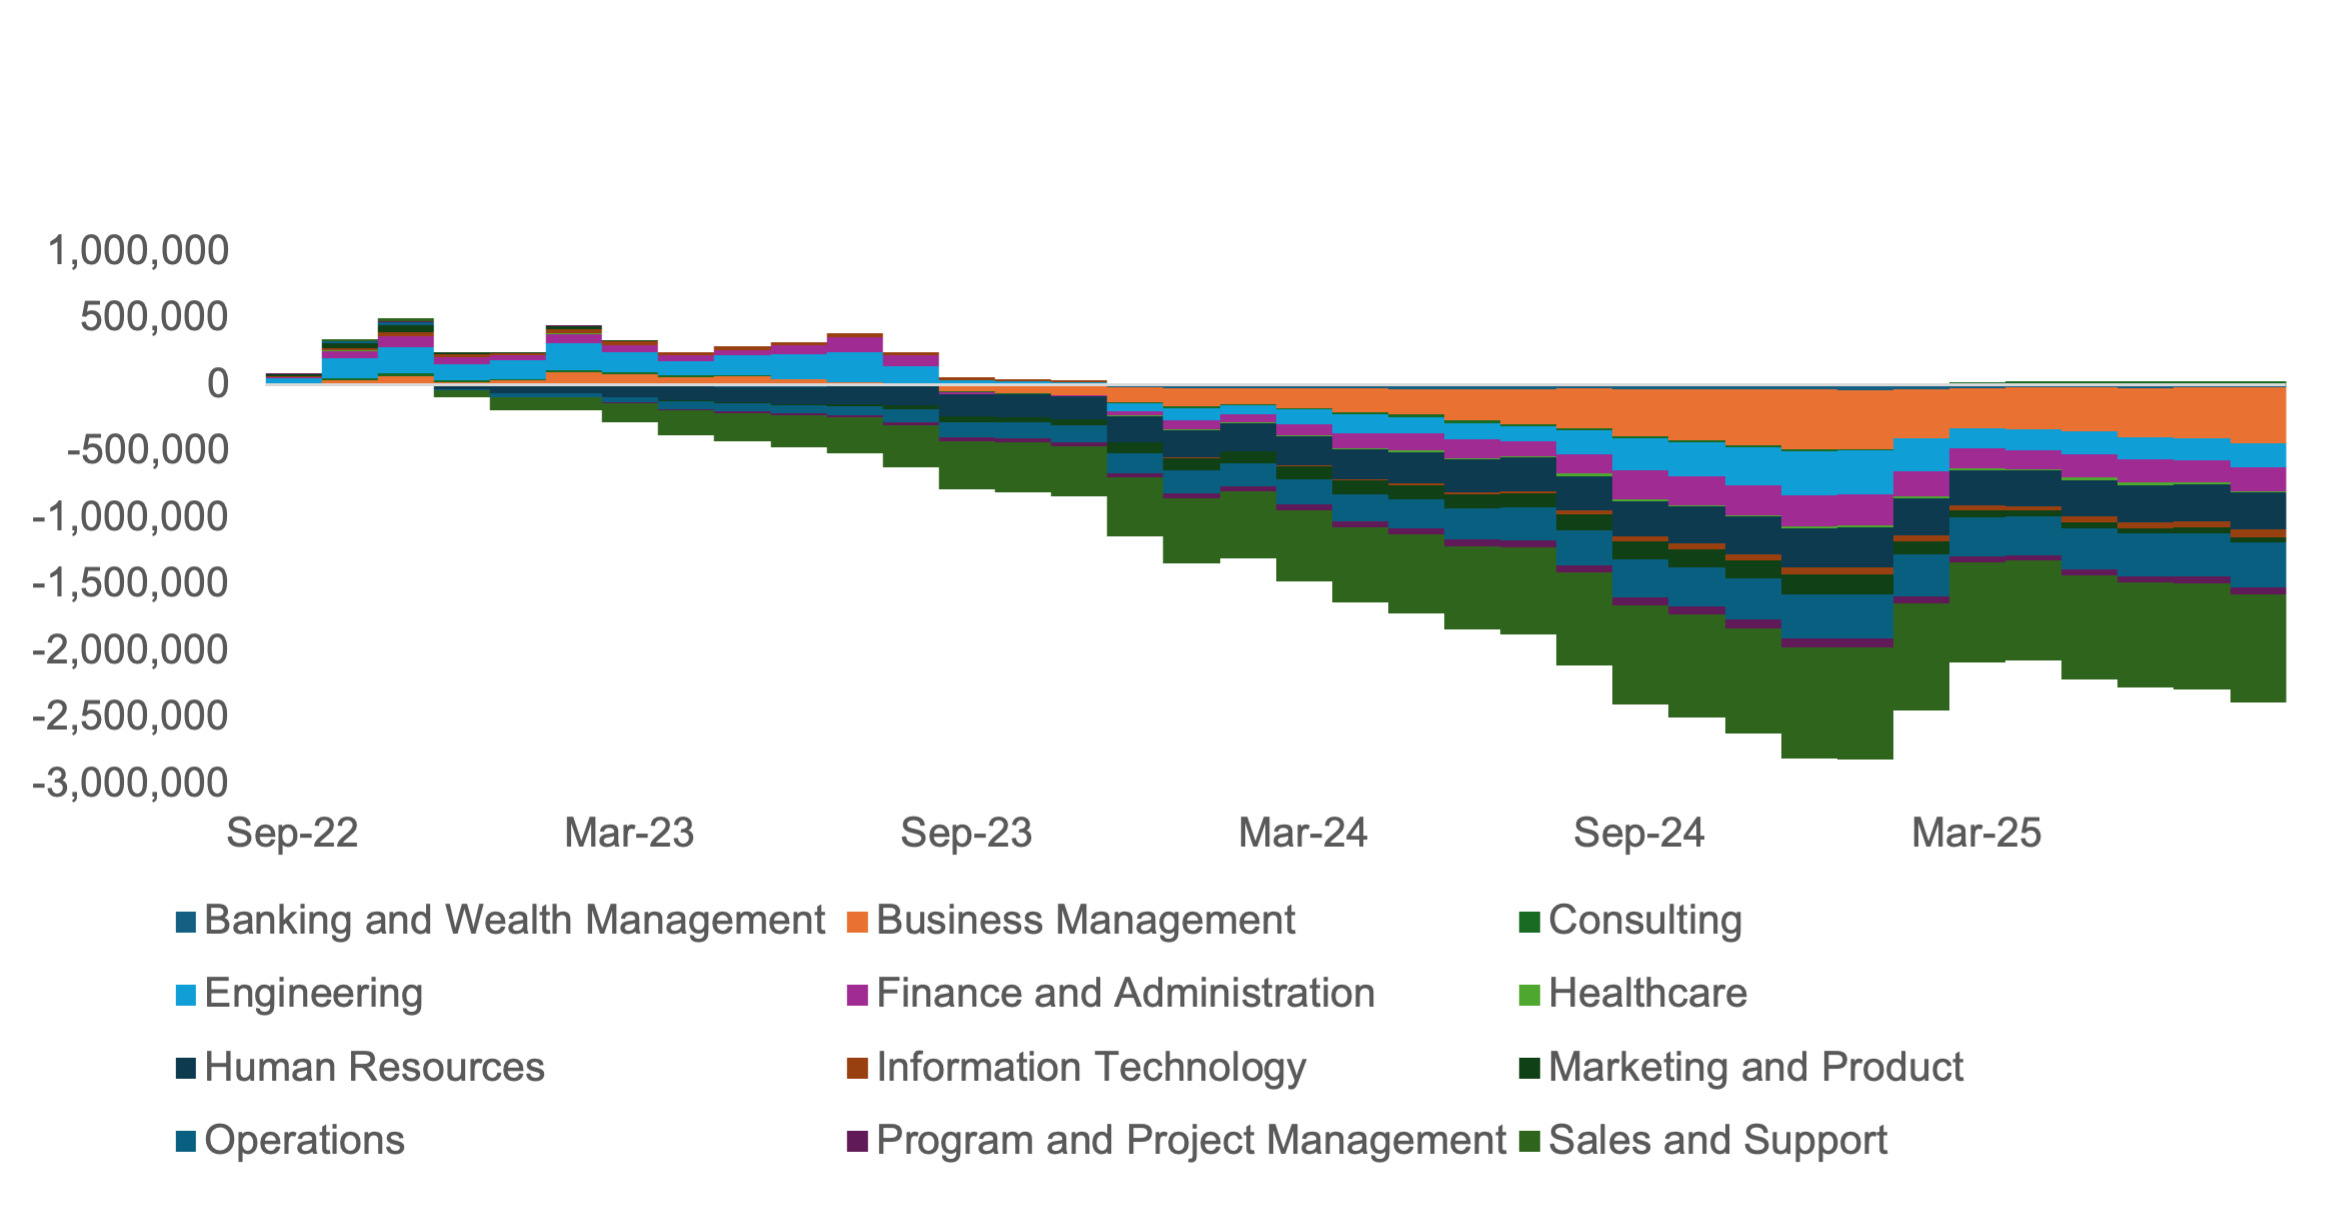
Exhibit 2: Cumulative Job Growth by Employee Level
Cohorts
Carbon Arc’s SMB Workforce data asset also provides visibility into workforce demographics by generation. As expected, Gen Z shows positive employment and salary growth as they enter the labor market, while Baby Boomers exhibit declines as they retire.
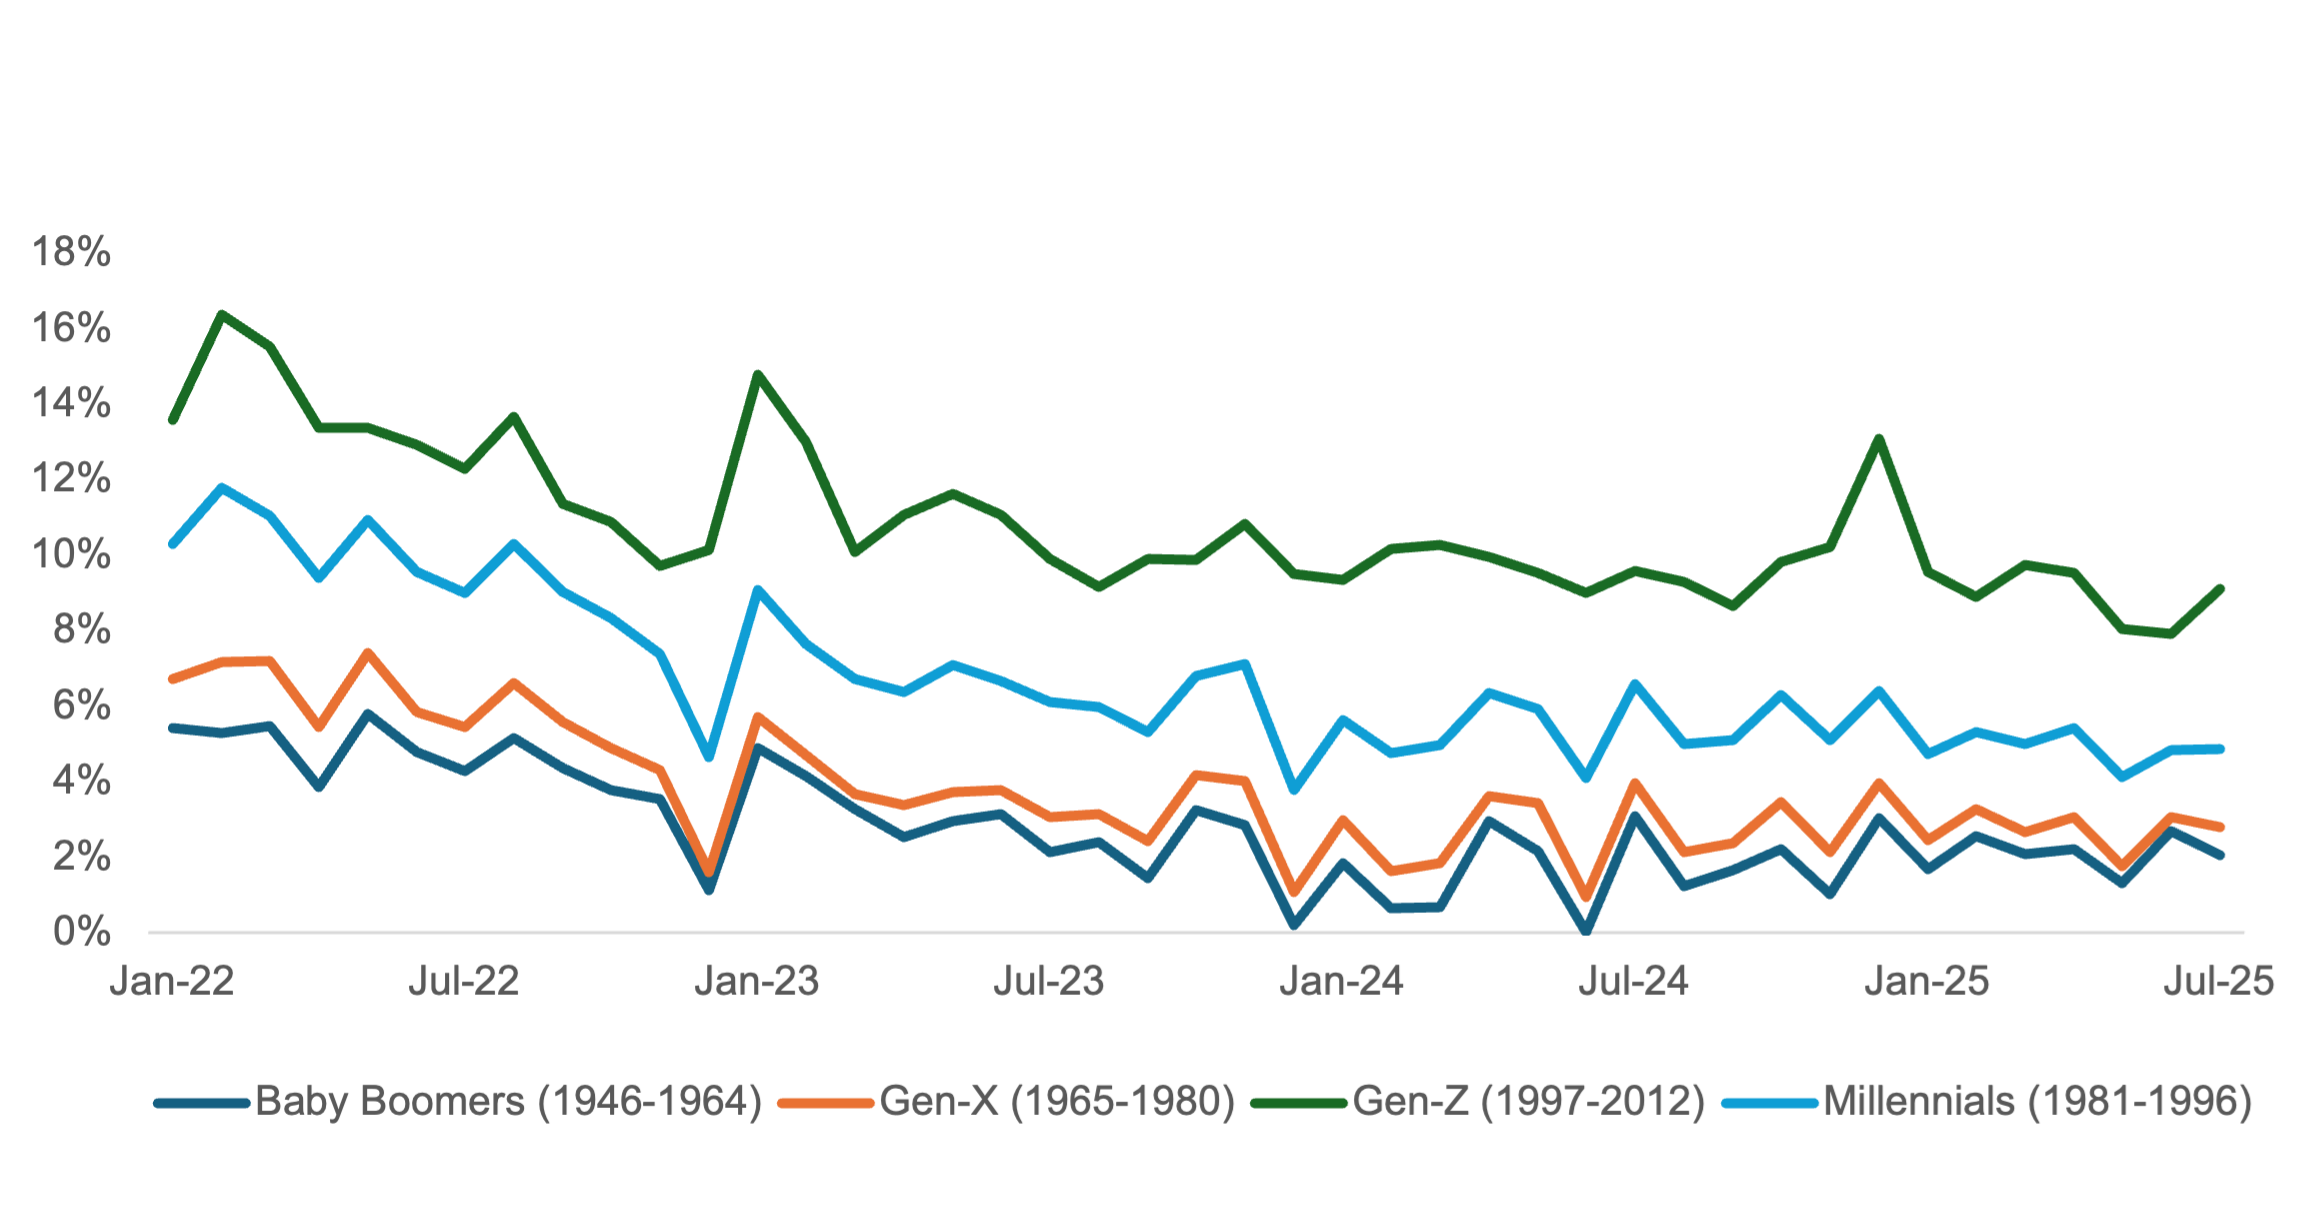
More concerning is the negative trend among Millennials – who are in their prime working years – which underscores further signs of labor market weakness. Despite weaker overall workforce growth, Millennials experience stronger salary gains than Gen X, highlighting that career progression and wage momentum remain intact for younger cohorts.
Exhibit 3: SMB Workforce Full Time Workforce Growth Y/Y
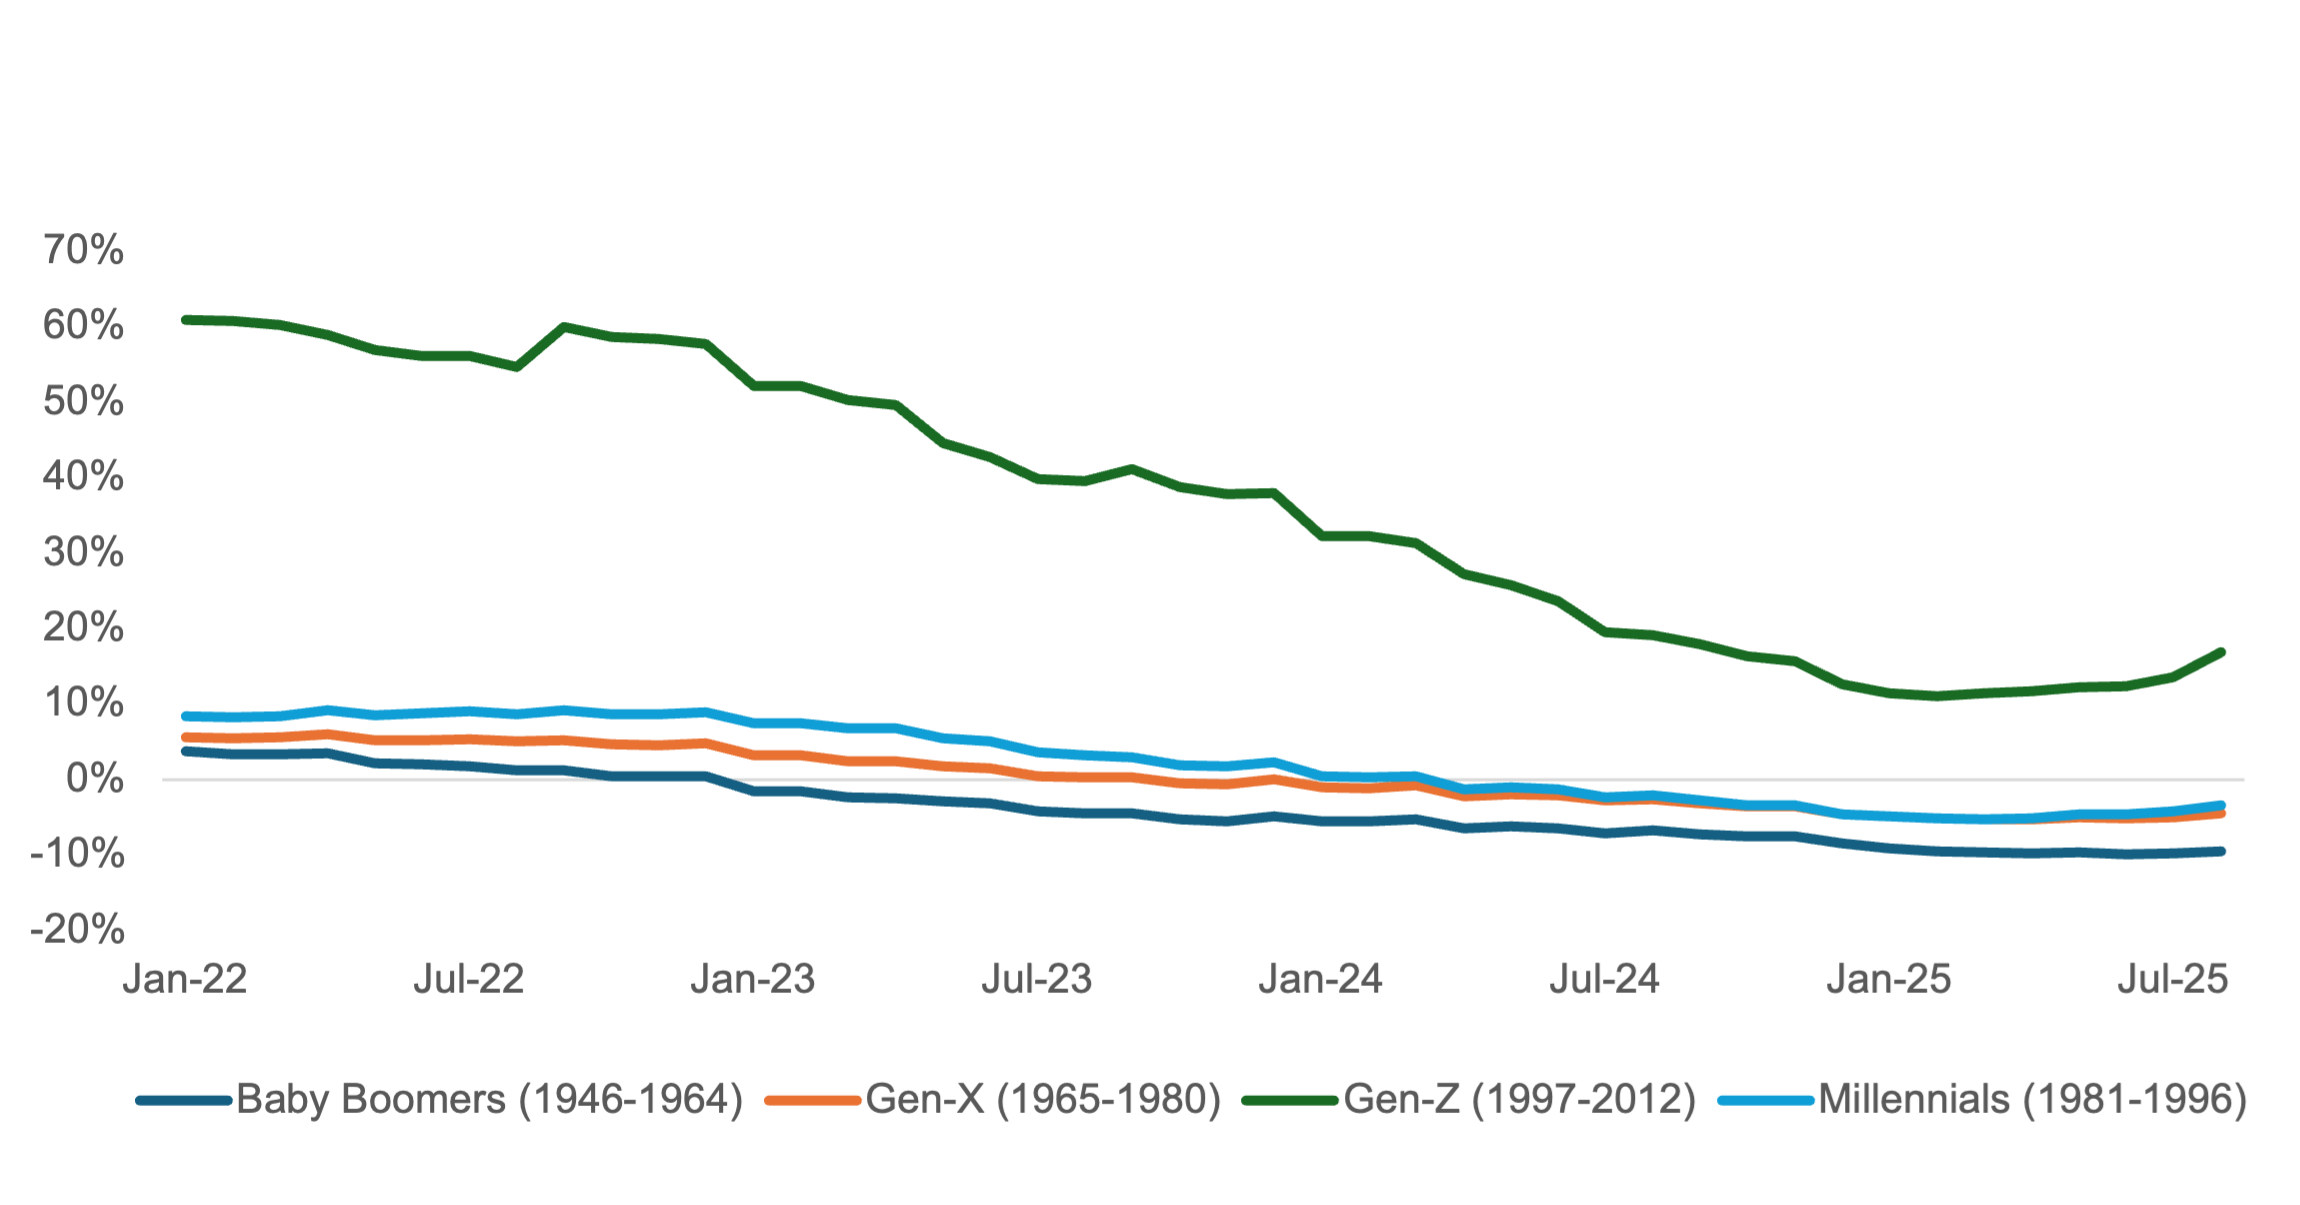
Exhibit 4: SMB Workforce Age Group Average Full Time Salary Growth Y/Y
Location-Based Insights
Salary and employment data at the level of Core-Based Statistical Areas (CBSAs), urban nucleuses based on counties, highlight regions with the weakest labor trends, and, when paired with Carbon Arc’s consumer spending data assets, point to the sectors most exposed to softer consumer demand.
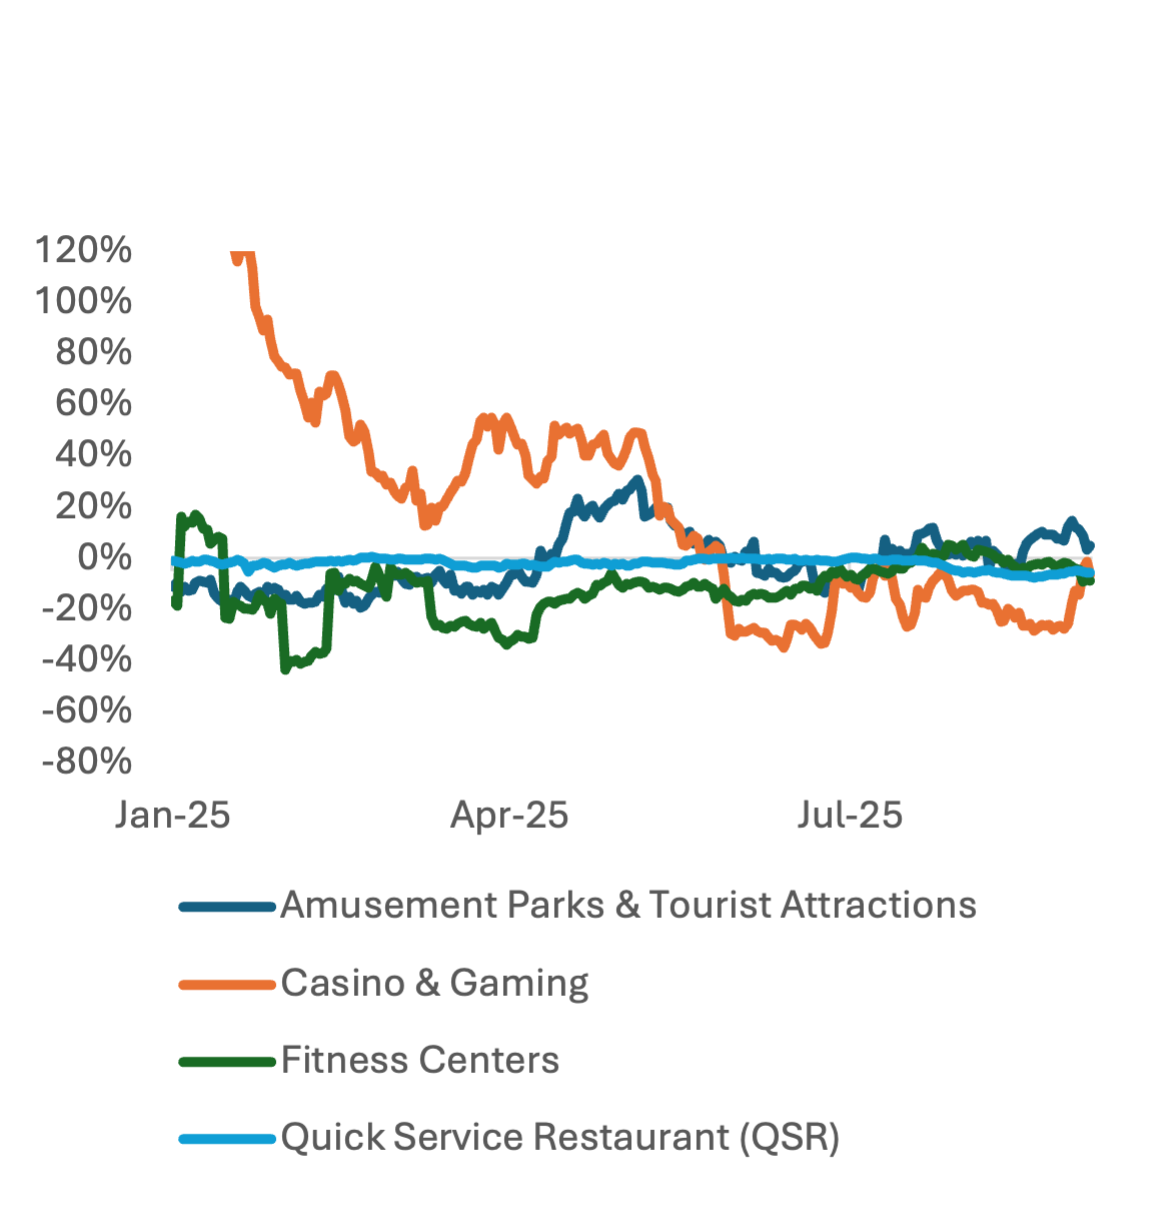
Comparing consumer spending in San Diego to consumer spending in Orlando and nationally shows significant weakness in spending at convenience stores and casino & gaming, both highly-discretionary and small-dollar categories.
Exhibit 5: SMB Workforce and Salary Growth in Top 25 CBSAs (July 2025)
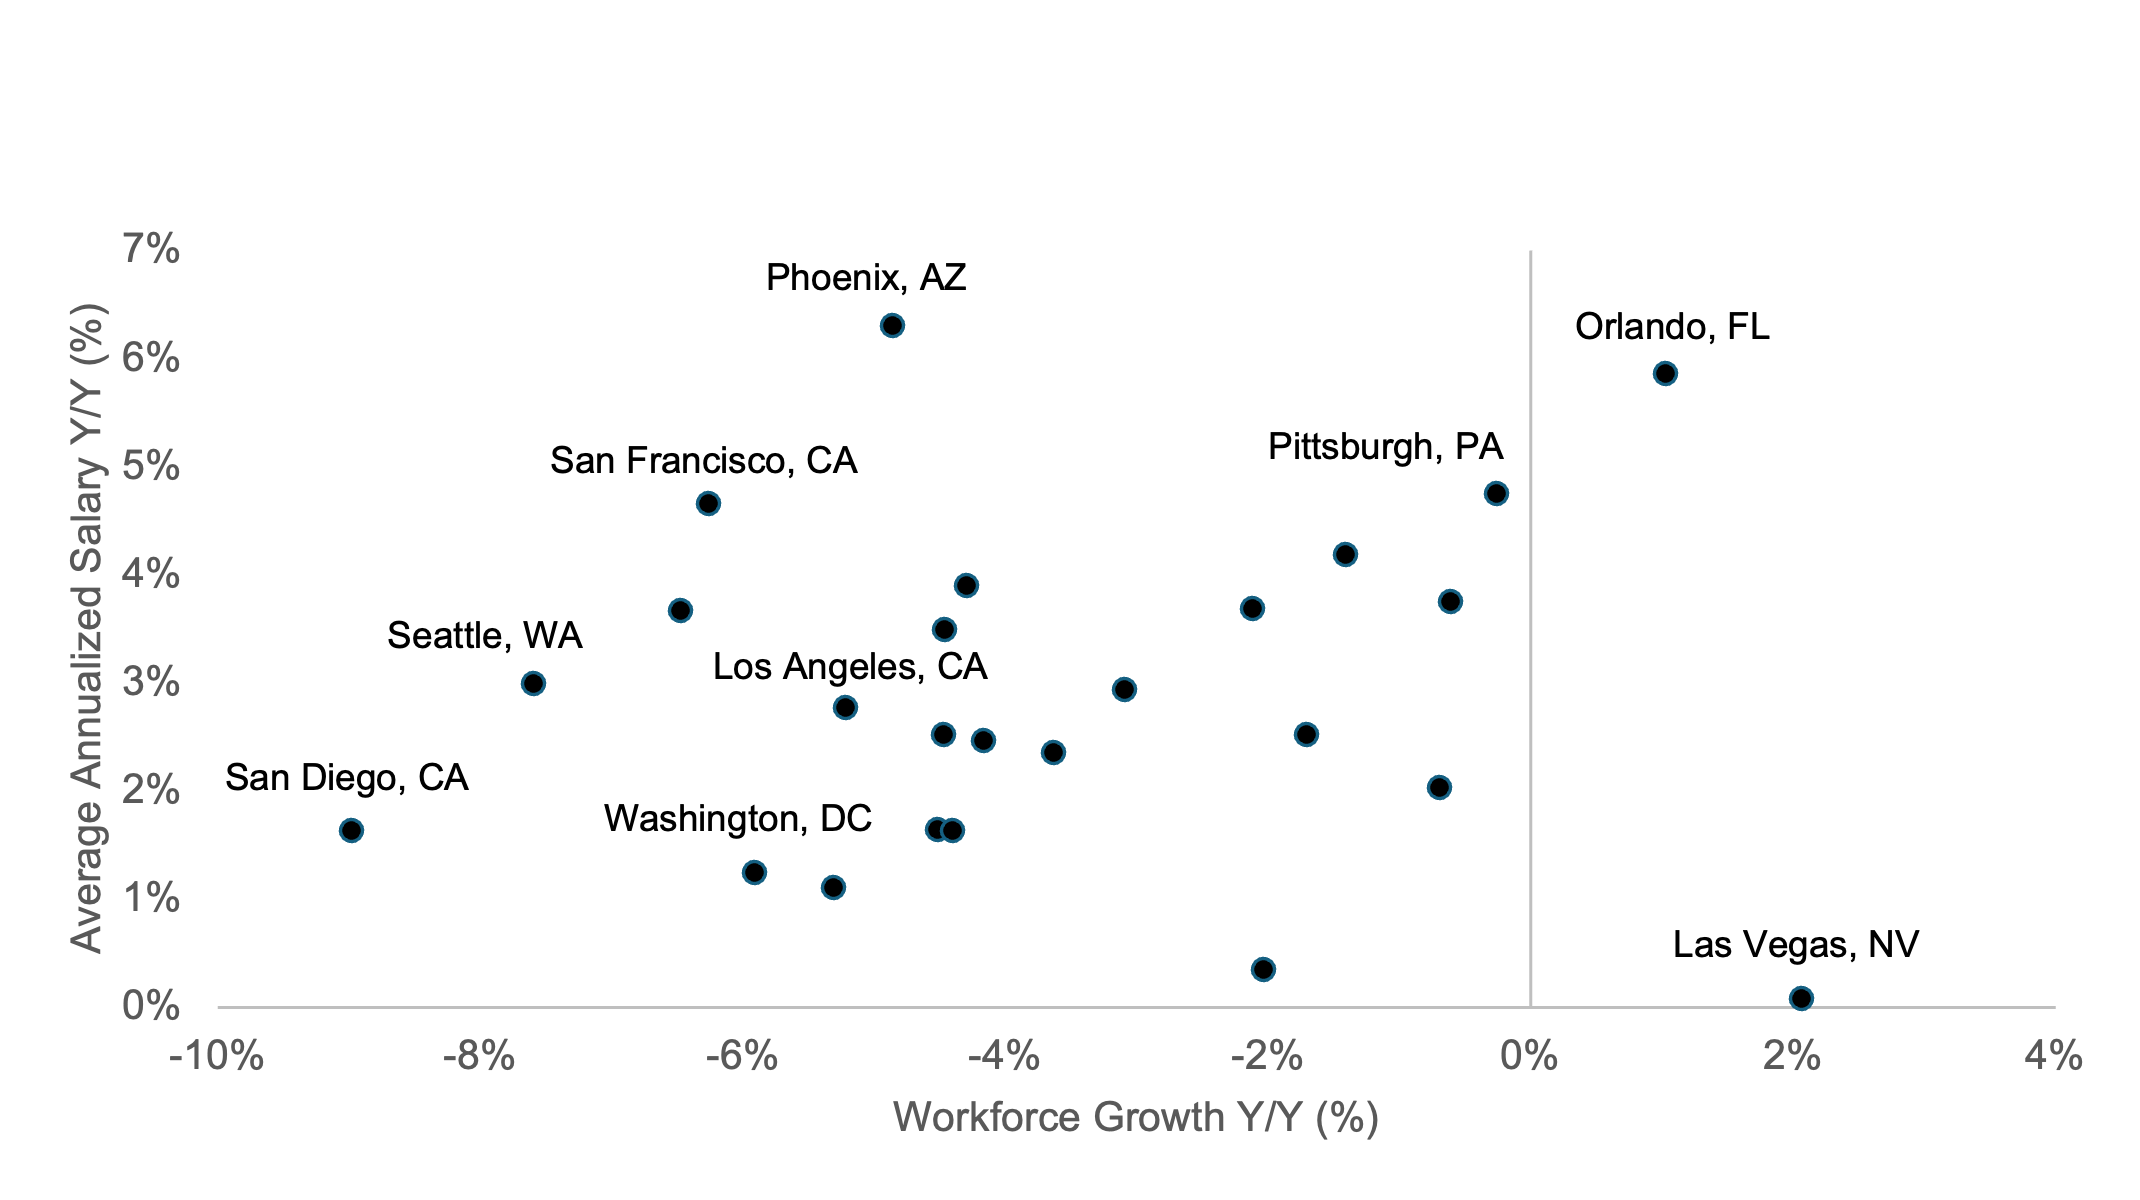
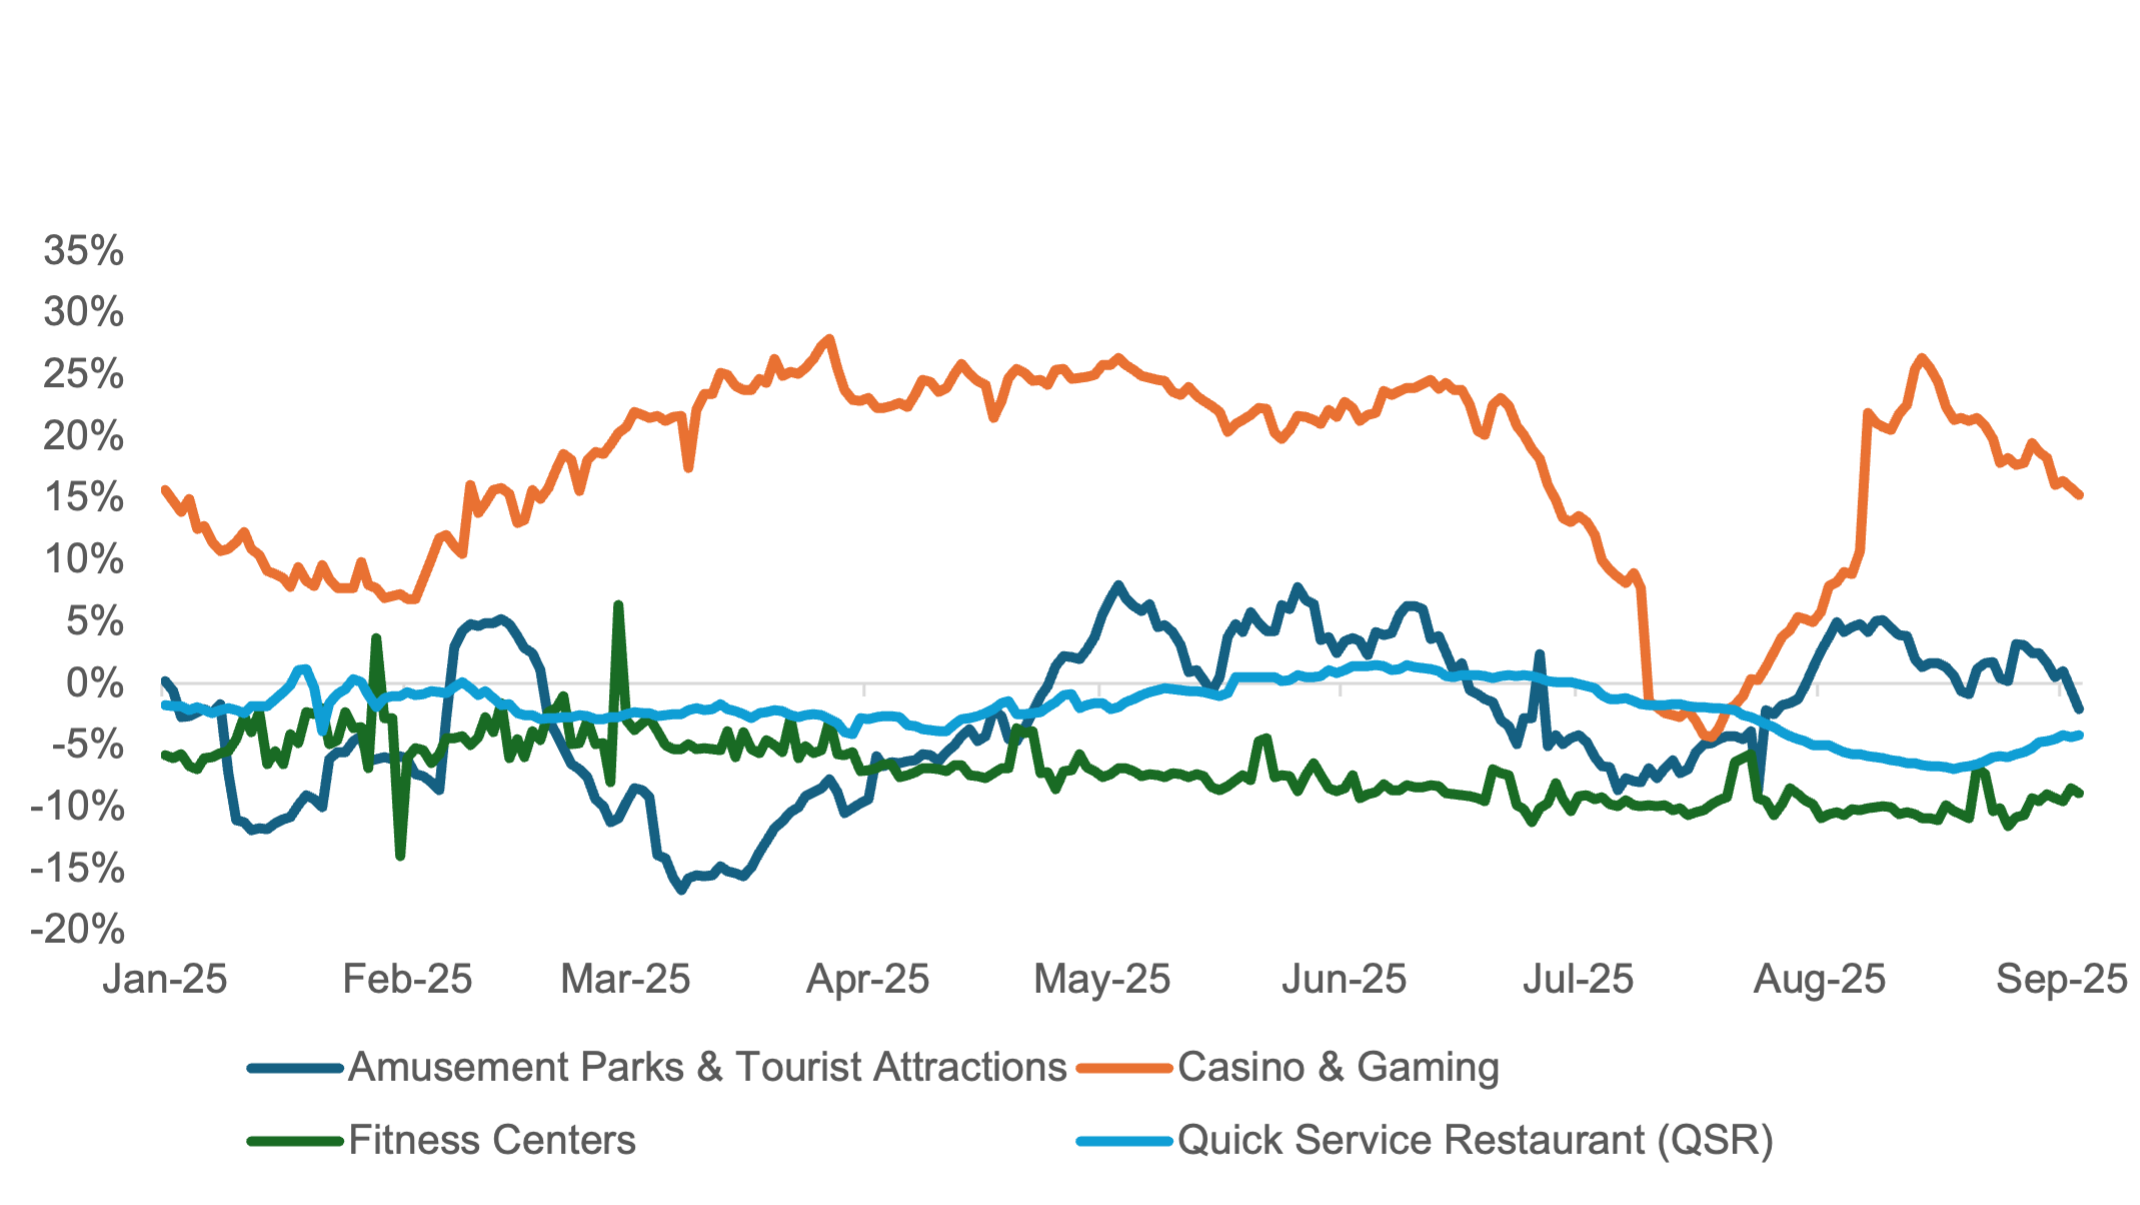
Exhibit 6: Retail Category Spend Growth in San Diego-Chula Vista-Carlsbad, CA (top) vs. Orlando-Kissimmee-Sanford, FL (bottom)
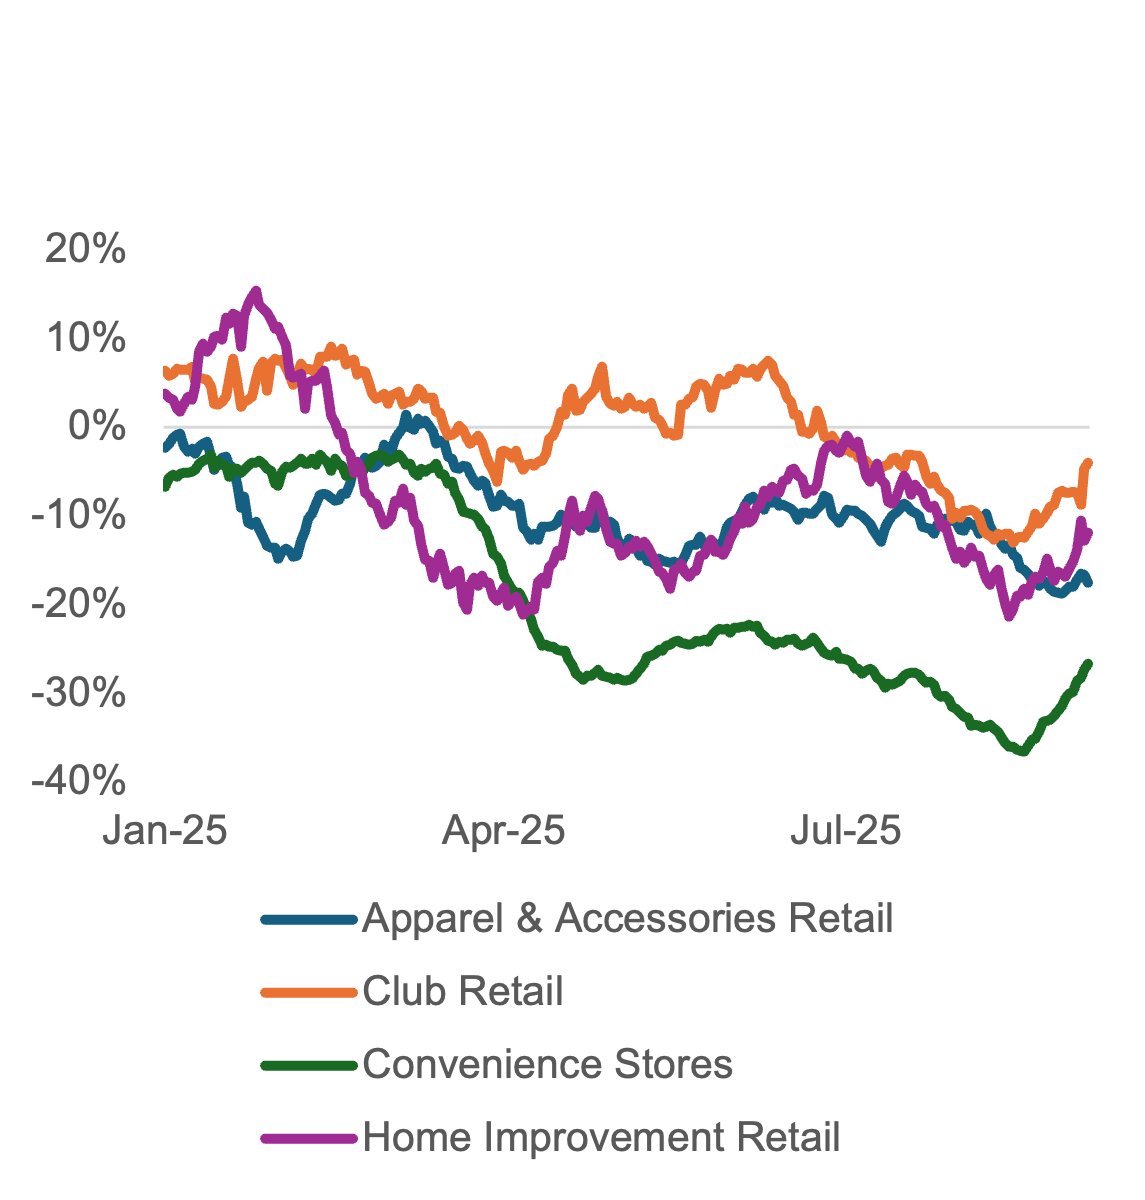
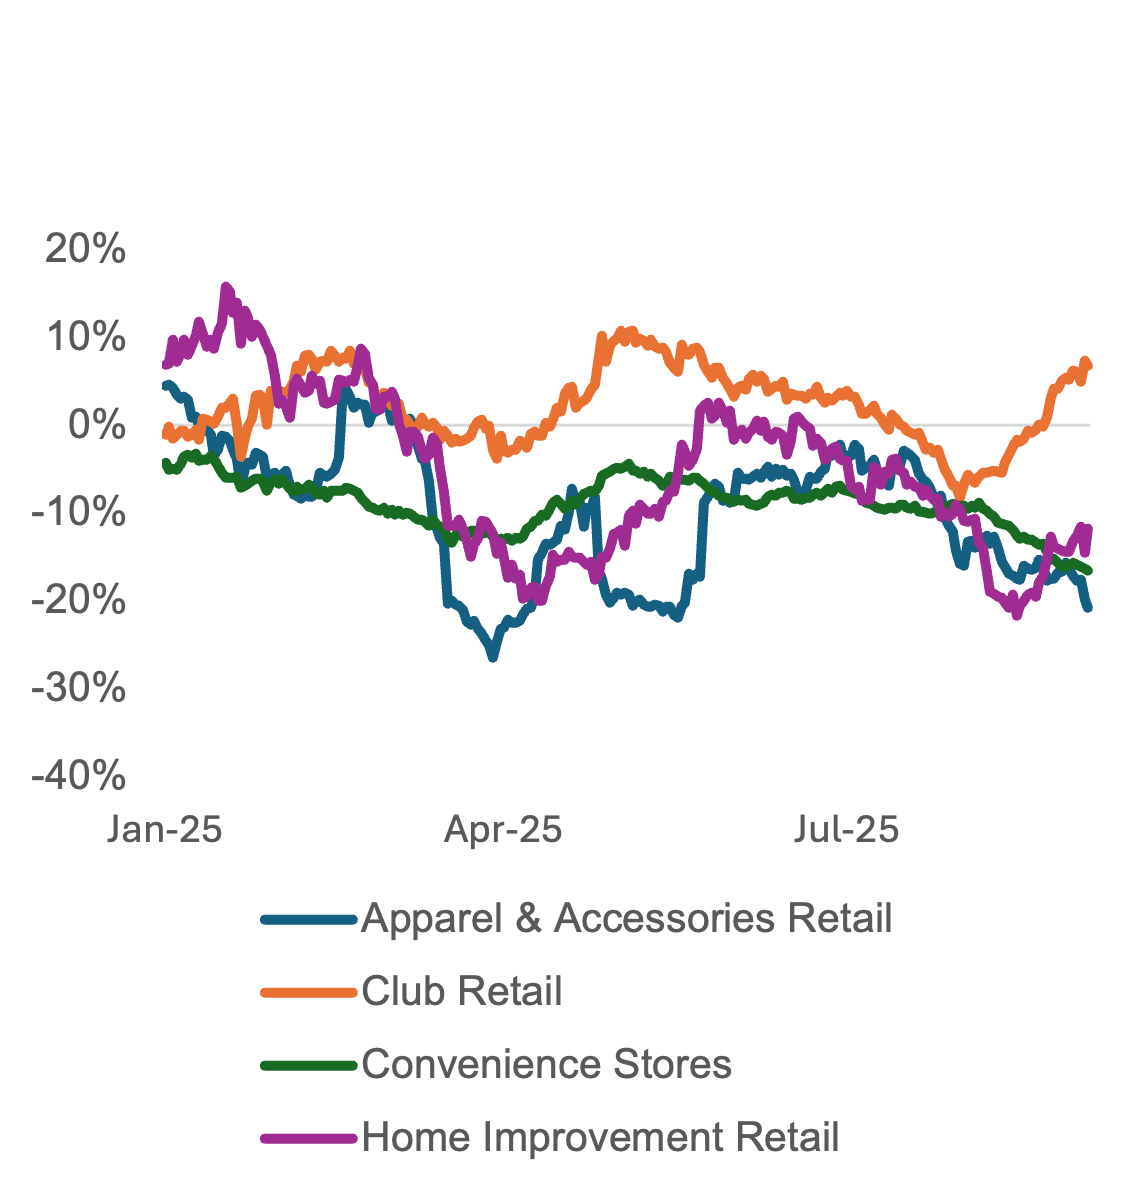
Exhibit 7: Service Category Spend Growth in San Diego-Chula Vista-Carlsbad, CA (top) vs. Orlando-Kissimmee-Sanford, FL (bottom)
Overall U.S. Employment Trends
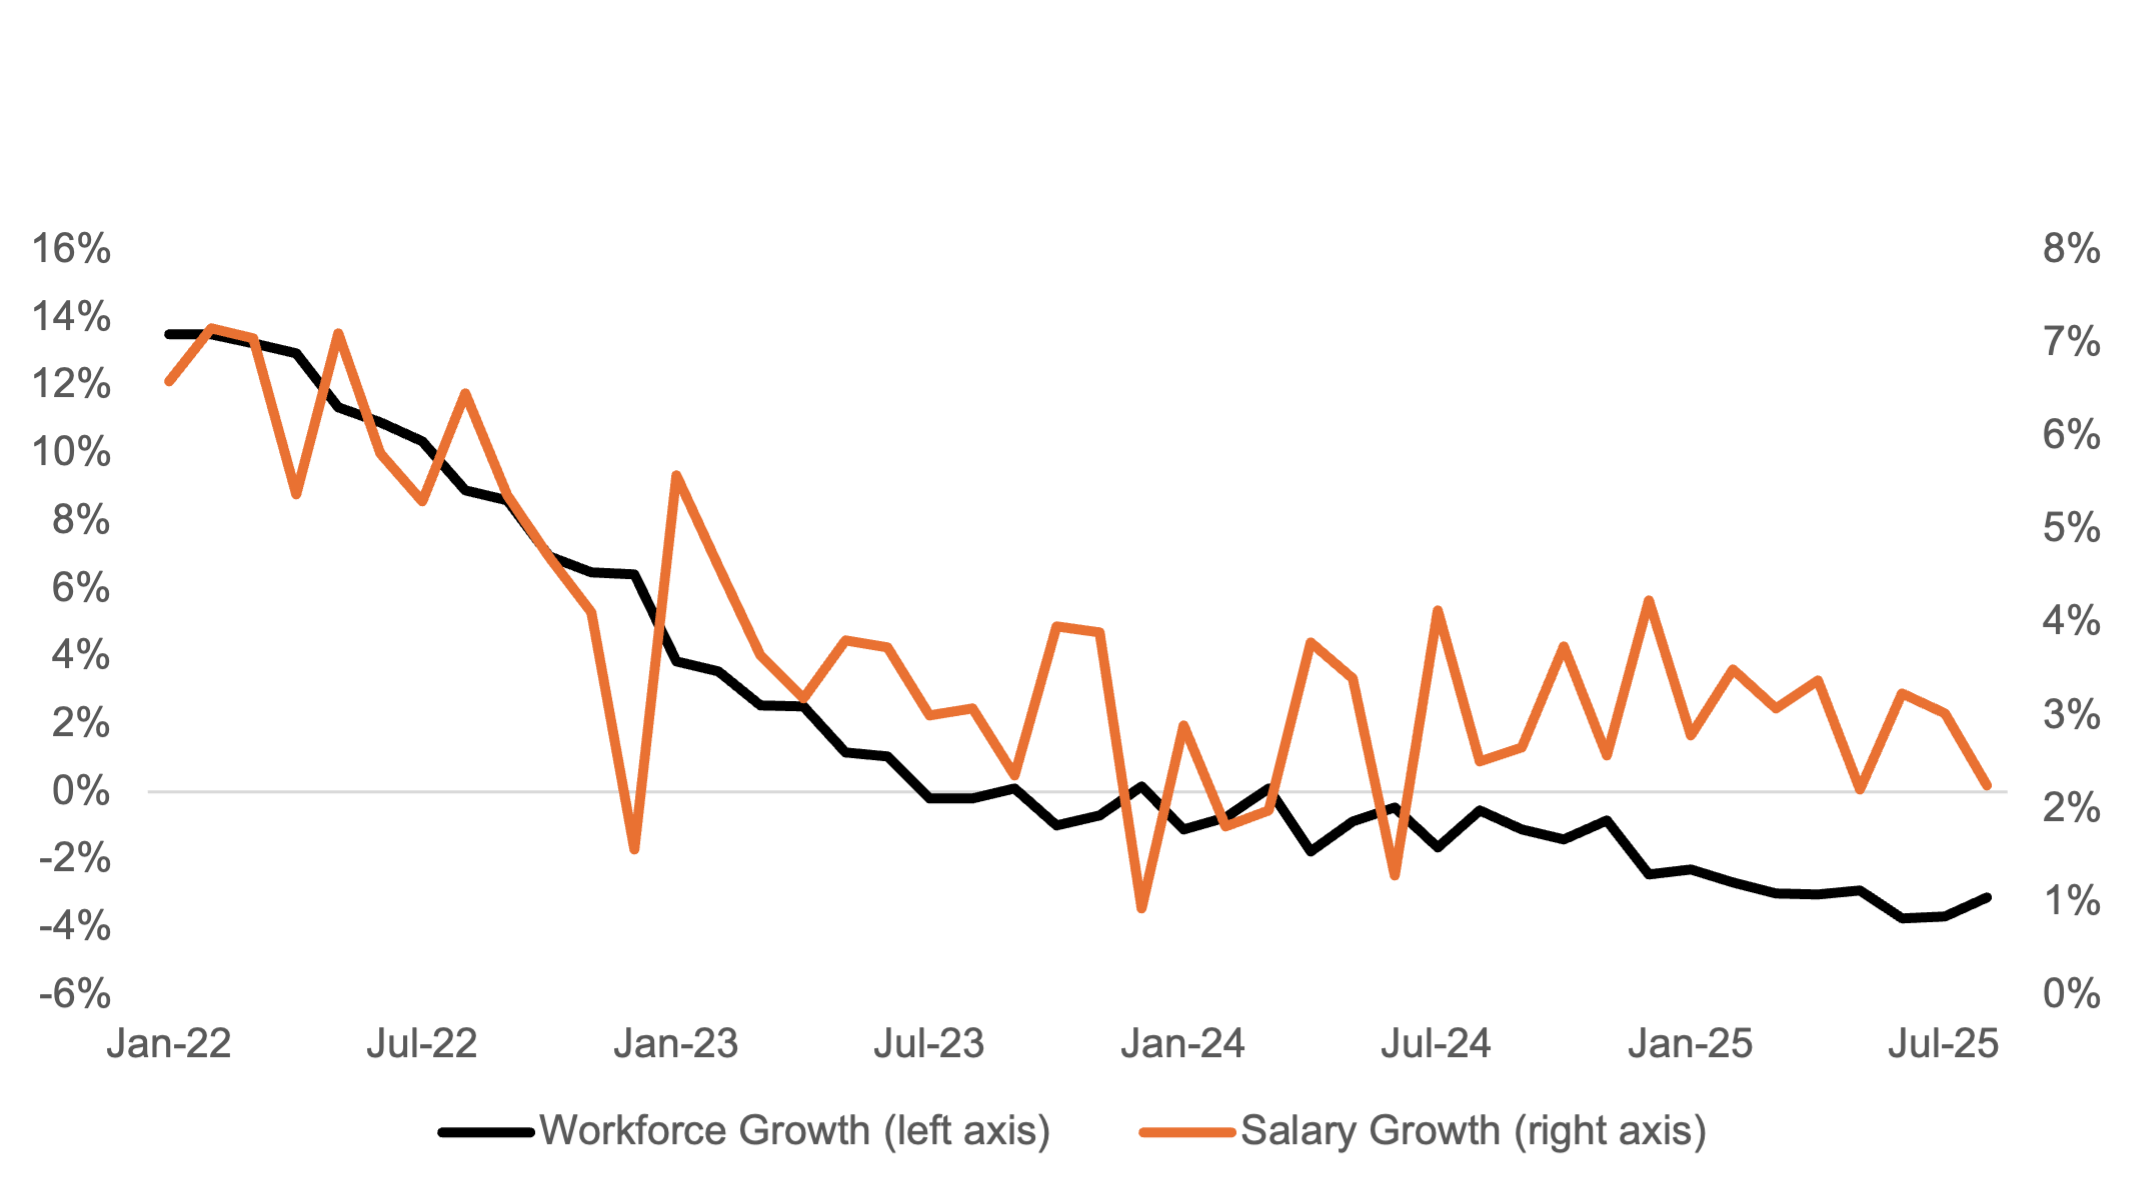
Carbon Arc’s SMB Workforce data, sourced from Paychex, shows that workforce growth rebounded strongly after the pandemic but turned negative in 3Q23 and is now down roughly 3% year-over-year.
Meanwhile, salary growth has leveled off around 3% Y/Y, tracking close to inflation, highlighting a sluggish job market where hiring is slowing but wages remain elevated.
Exhibit 8: SMB Workforce Full-Time U.S. Workforce and Salary Growth
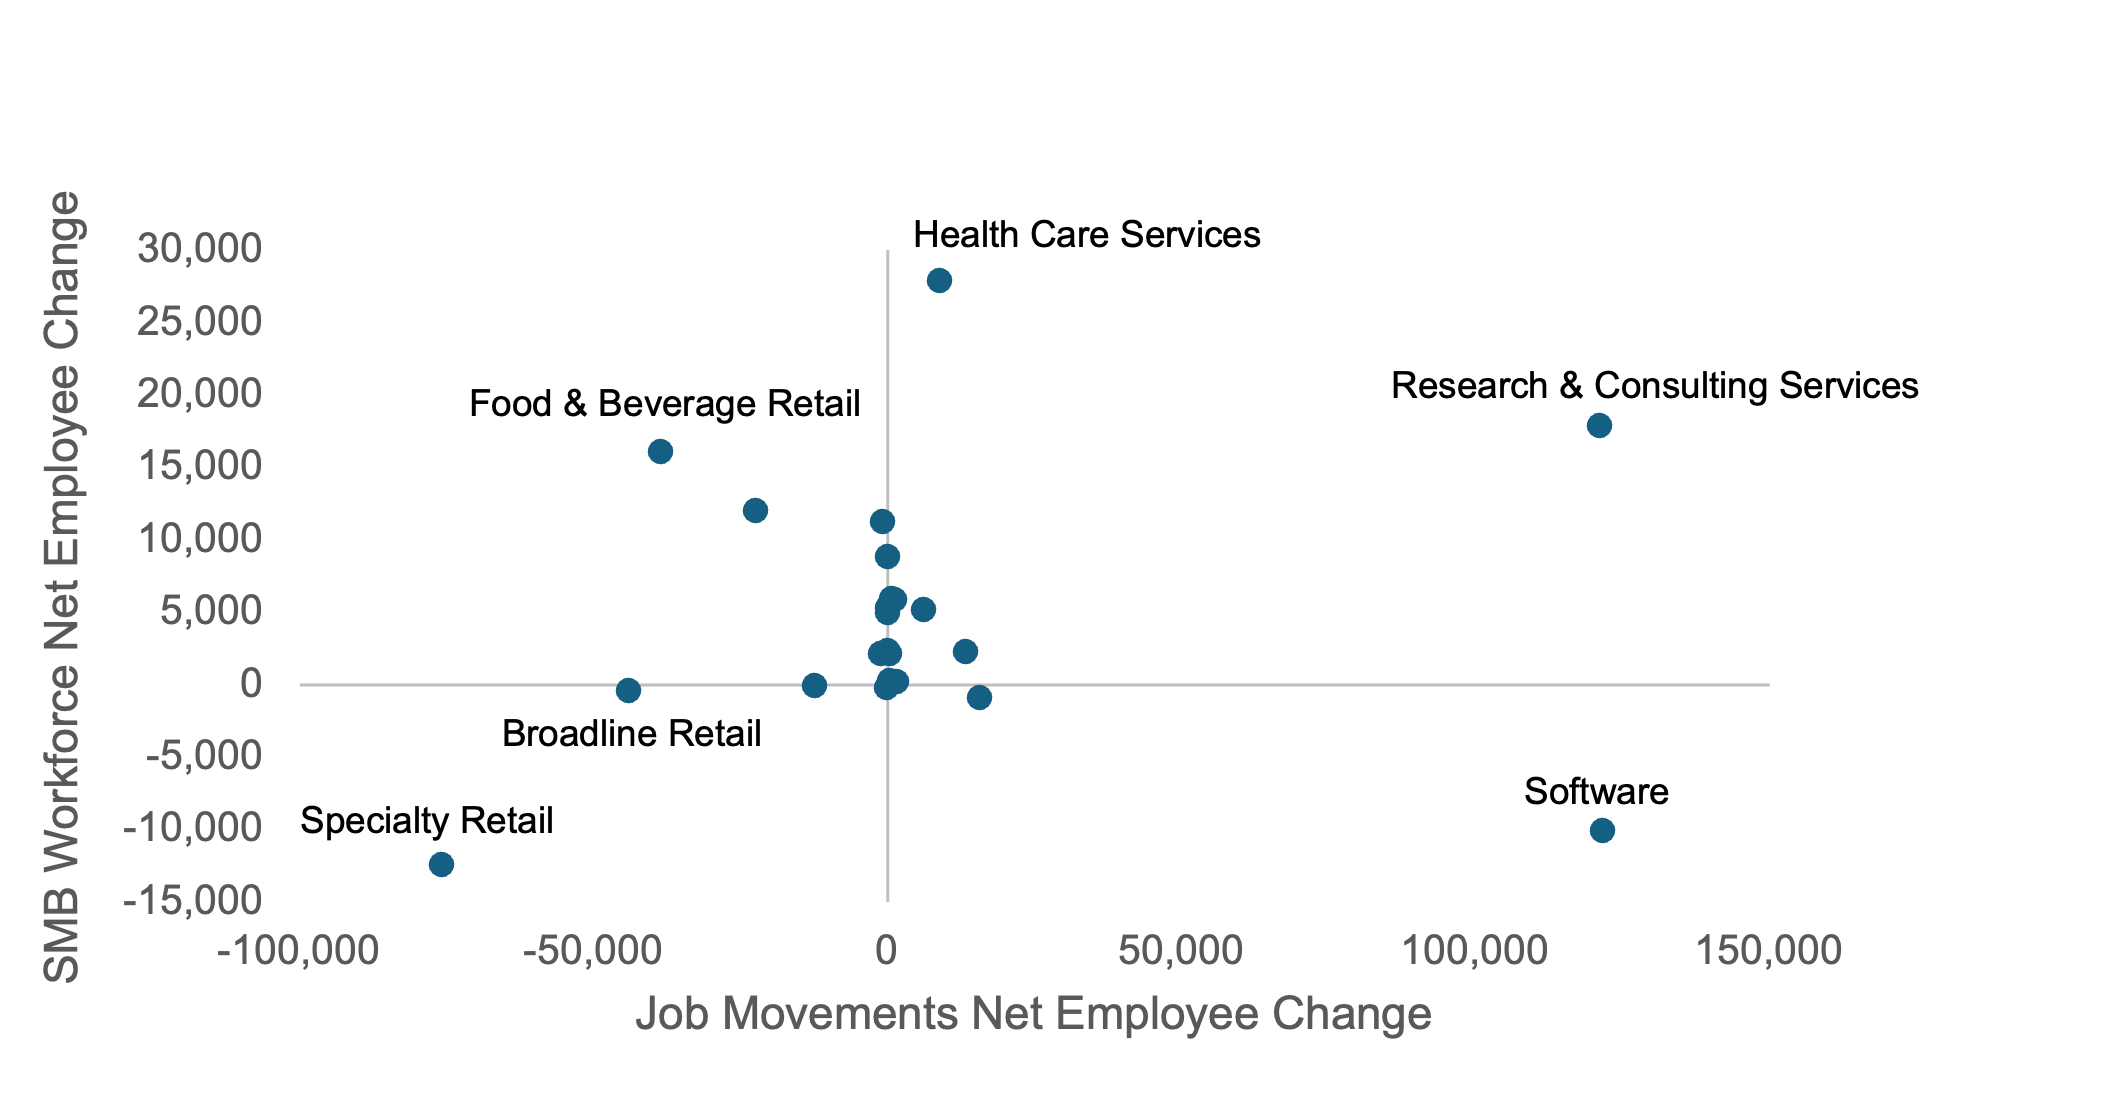
Both the SMB Workforce and Job Movements data assets show significant growth in Research & Consulting and substantial losses in Specialty Retail. Gains in Software in the Job Movements data asset may signal variation across large vs. SMB organizations.
Exhibit 9: Jan 2021 – Jul 2025 Net Workforce Growth by Employer Category
Appendix
The charts below provide retail and service category level spend growth for select categories at the US level, to supplement the charts in Exhibit 6 and Exhibit 7.
Exhibit 10: Retail Category Spend Growth, US
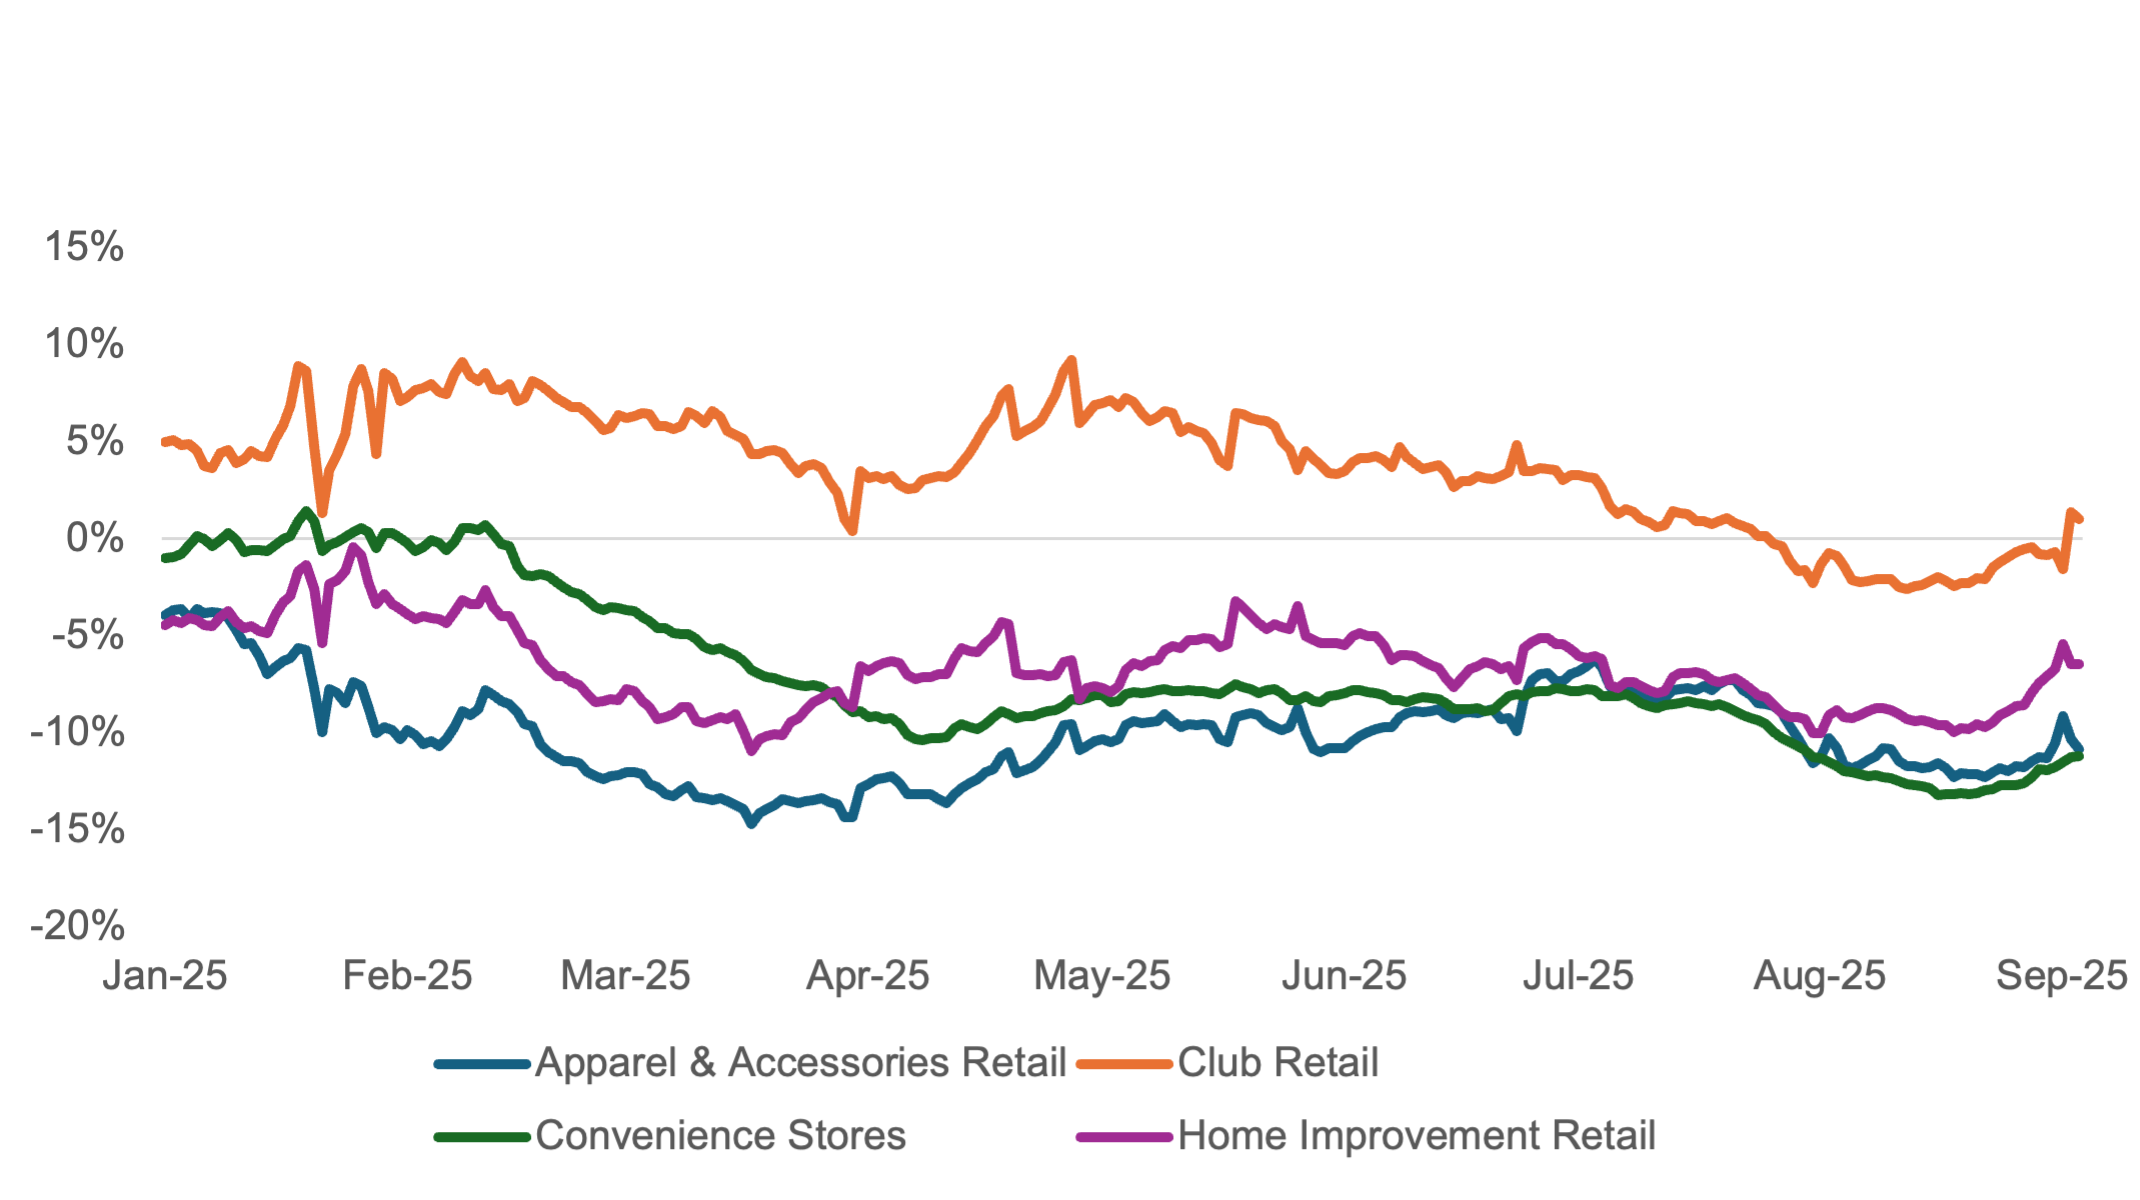
Exhibit 11: Service Category Spend Growth, US
The charts below provide trends by job function and seniority for select functions and levels, to supplement Exhibit 1 and Exhibit 2.
Exhibit 12: Cumulative Job Growth by Employee Function, Select Functions
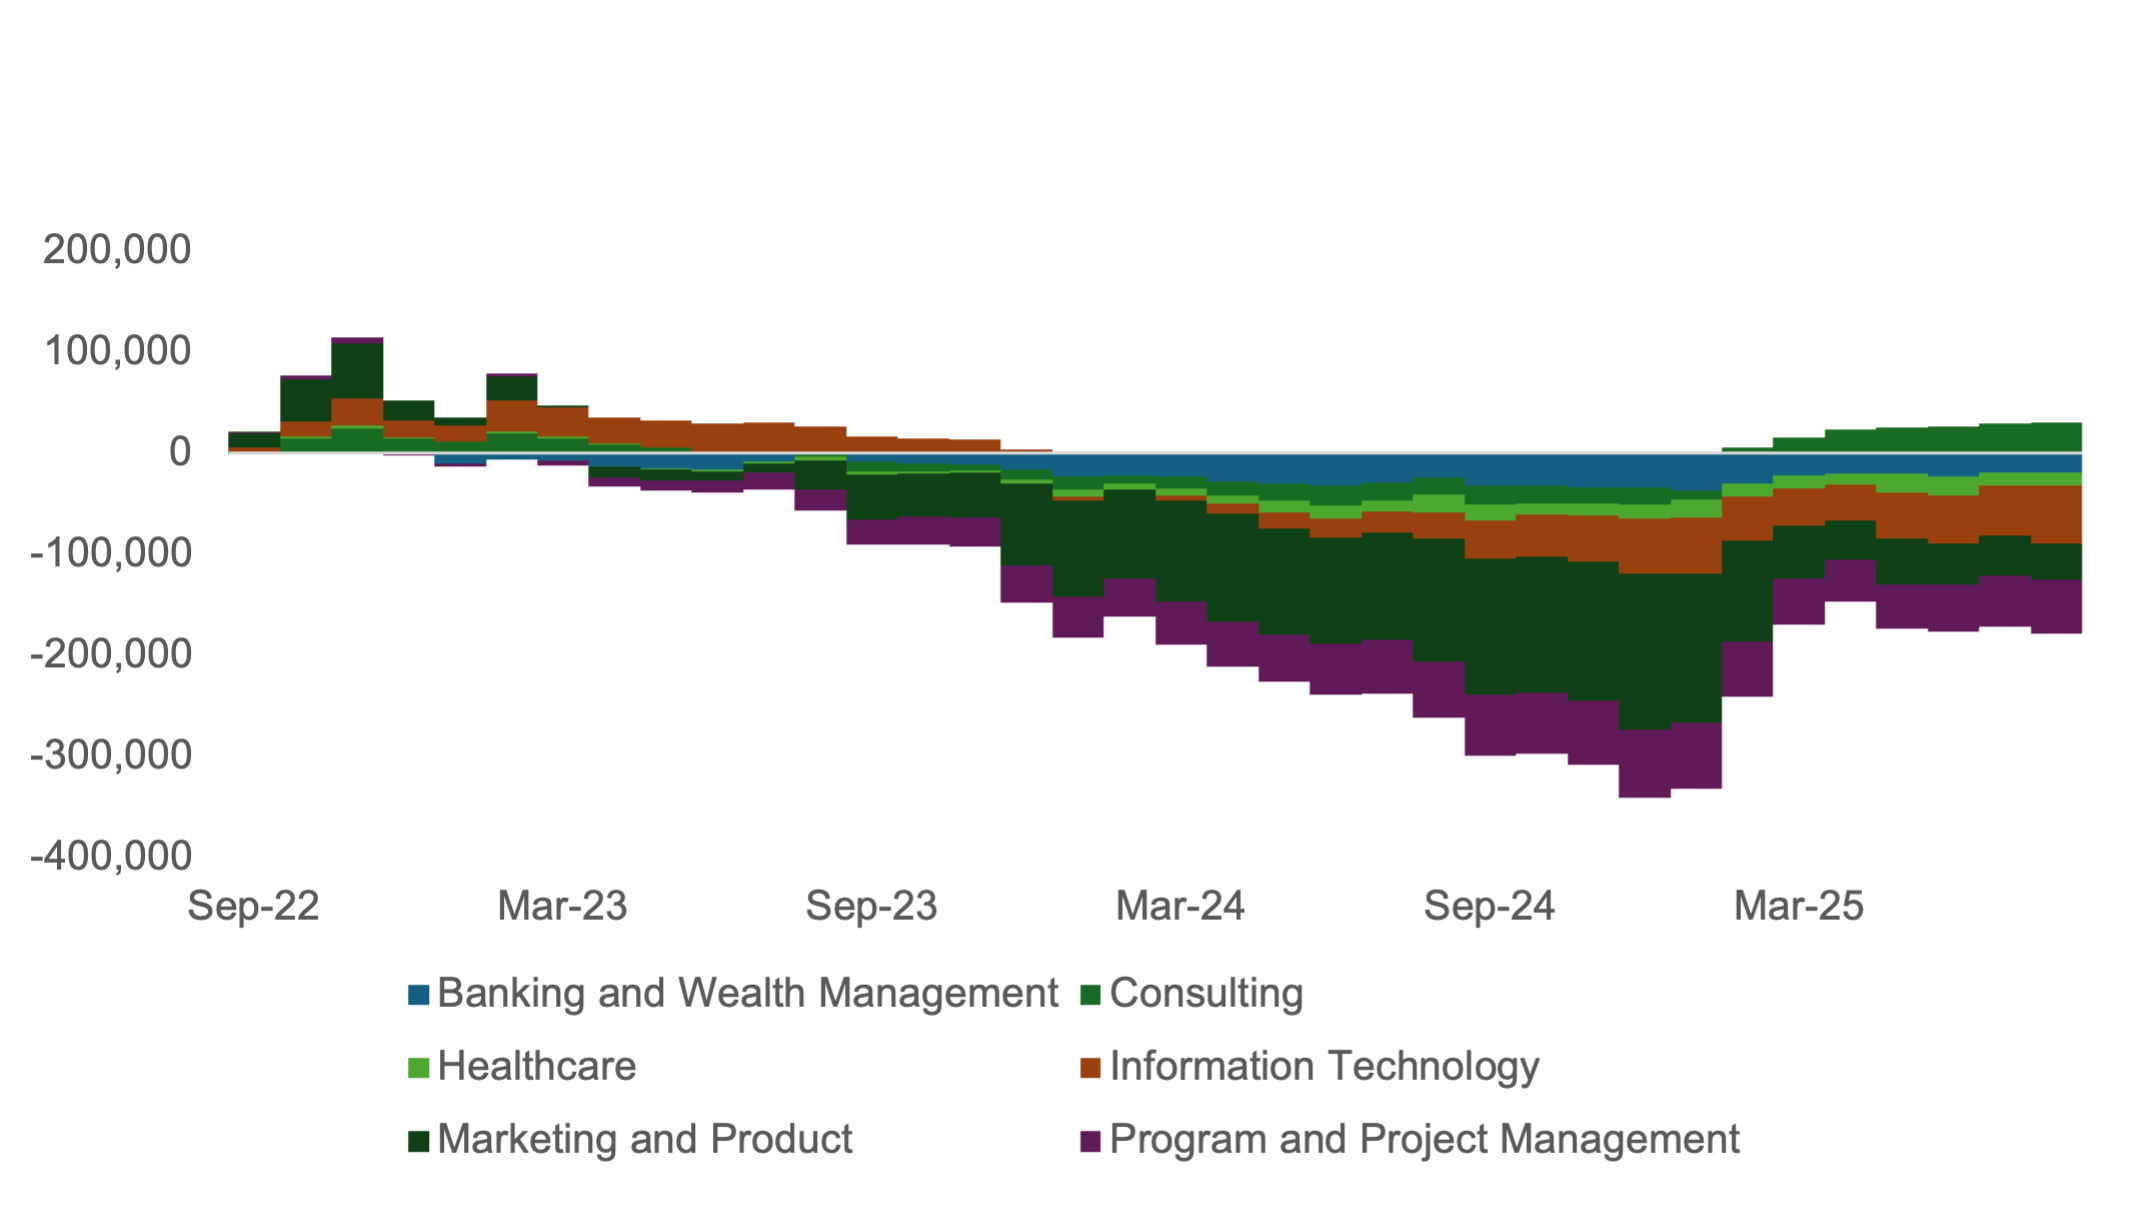
Exhibit 13: Cumulative Job Growth by Employee Level, Select Levels
References
-
New York Times. “Job Market Slows Significantly, Raising Economic Jitters.” New York Times Business, August 2, 2024. https://www.nytimes.com/2024/08/02/business/economy/july-jobs-report-what-to-know.html
-
New York Times. “Employers Added Nearly a Million Fewer Jobs Than Believed, Data Shows.” New York Times Business, September 9, 2025. https://www.nytimes.com/2025/09/09/business/jobs-revisions-economy-fed.html
Methodology
Carbon Arc's framework-based approach reimagines how data should be accessed and priced. At its core, our approach recognizes that every data interaction follows the same elegant structure:
Entity + Insight + Filters = Value
- Entity: The subject of analysis (company, brand, person, location, commodity)
- Insight: The specific data point or analytical output you need
- Filters: The dimensions that matter to your use case (space, time, industry, size, etc.)
Exhibit 1:
Framework = {"insight": {"insight_id": 694},"entities": {"carc_name": "*","representation": "category"},"filters": {"date_resolution": "month","location_resolution": "ww","date_range": {"start_date": "2022-09-01","end_date": "2025-09-03"},"level": "*","function": "*"},"aggregate": "sum"}
Exhibit 2: Same as Exhibit 1.
Exhibit 3:
Framework= {"insight": {"insight_id": 5382},"entities": [{"carc_id": 96,"representation": "country"}],"filters": {"date_resolution": "day","location_resolution": "us","date_range": {"start_date": "2021-01-01","end_date": "2025-09-11"},"active_worker": "*","employee_type": ["Full Time"],"country": "*”,”generation”:”*”},"aggregate": "mean"}
Exhibit 4:
Framework= {"insight": {"insight_id": 3739},"entities": [{"carc_name": “*”,"representation": ”generation"}],"filters": {"date_resolution": "day","location_resolution": "us","date_range": {"start_date": "2021-01-01","end_date": "2025-09-11"},"active_worker": "*","employee_type": ["Full Time"]},"aggregate": "mean"}

Framework= {"insight": {"insight_id": 3741},"entities": [{"carc_name": “*”,"representation": ”generation"}],"filters": {"date_resolution": "day","location_resolution": "us","date_range": {"start_date": "2021-01-01","end_date": "2025-09-11"},"active_worker": "*","employee_type": ["Full Time"]},"aggregate": "mean"}
Exhibit 5:
Framework= {"insight": {"insight_id": 5382},"entities": [{"carc_name": “*”,"representation": ”cbsa"}],"filters": {"date_resolution": "day","location_resolution": ”cbsa","date_range": {"start_date": "2024-01-01","end_date": "2025-09-11"},"active_worker": "*","employee_type": ["Full Time"]},"aggregate": "mean"}

Framework= {"insight": {"insight_id": 3739},"entities": [{"carc_name": “*”,"representation": ”cbsa"}],"filters": {"date_resolution": "day","location_resolution": ”cbsa","date_range": {"start_date": "2024-01-01","end_date": "2025-09-11"},"active_worker": "*","employee_type": ["Full Time"]},"aggregate": "mean"}

Framework= {"insight": {"insight_id": 3741},"entities": [{"carc_name": “*”,"representation": ”cbsa"}],"filters": {"date_resolution": "day","location_resolution": ”cbsa","date_range": {"start_date": "2024-01-01","end_date": "2025-09-11"},"active_worker": "*","employee_type": ["Full Time"]},"aggregate": "mean"}
Exhibit 6:
Framework= {"insight": {"insight_id": 765},"entities": [{"carc_id": 796,"representation": "category"}, {"carc_id": 345,"representation": "category"}, {"carc_id": 75,"representation": "category"}, {"carc_id": 350,"representation": "category"}],"filters": {"date_resolution": "day","location_resolution": "cbsa","date_range": {"start_date": "2024-01-01","end_date": "2025-09-11"},"transaction_method": "*","cbsa_name": ["Orlando-Kissimmee-Sanford, FL","San Diego-Chula Vista-Carlsbad, CA"]},"aggregate": "sum"}
Exhibit 7:
Framework = {"insight": {"insight_id": 765},"entities": [{"carc_id": 949,"representation": "category"}, {"carc_id": 5,"representation": "category”}, {"carc_id": 936,"representation": "category”}, {"carc_id": 924,"representation": "category”}],"filters": {"date_resolution": "day","location_resolution": "cbsa","date_range": {"start_date": "2024-01-01","end_date": "2025-09-11"},"transaction_method": "*","cbsa_name": ["Orlando-Kissimmee-Sanford, FL","San Diego-Chula Vista-Carlsbad, CA"]},"aggregate": "sum"}
Exhibit 8:
Framework = {"insight": {"insight_id": 5382},"entities": [{"carc_id": 96,"representation": "country"}],"filters": {"date_resolution": "day","location_resolution": "us","date_range": {"start_date": "2021-01-01","end_date": "2025-09-11"},"active_worker": "*","employee_type": ["Full Time"],"country": "*"},"aggregate": "mean"}

Framework= {"insight": {"insight_id": 3739},"entities": [{"carc_id": 96,"representation": "country"}],"filters": {"date_resolution": "day","location_resolution": "us","date_range": {"start_date": "2021-01-01","end_date": "2025-09-11"},"active_worker": "*","employee_type": ["Full Time"],"country": "*"},"aggregate": ”sum"}

Framework= {"insight": {"insight_id": 3741},"entities": [{"carc_id": 96,"representation": "country"}],"filters": {"date_resolution": "day","location_resolution": "us","date_range": {"start_date": "2021-01-01","end_date": "2025-09-11"},"active_worker": "*","employee_type": ["Full Time"],"country": "*"},"aggregate": ”sum"}
Exhibit 9:
Framework = {"insight": {"insight_id": 5382},"entities": [{"carc_name": “*”,"representation": "category"}],"filters": {"date_resolution": "day","location_resolution": "us","date_range": {"start_date": "2020-12-01","end_date": "2025-09-11"},"active_worker": "*","employee_type": ”*"},"aggregate": "mean"}

Framework = {"insight": {"insight_id": 694},"entities": [{"carc_name": “*”,"representation": "category"}],"filters": {"date_resolution": ”month","location_resolution": ”ww","date_range": {"start_date": "2021-01-01","end_date": "2025-09-11"},”level": "*",”function": ”*"},"aggregate": ”sum"}
Exhibit 10:
{"insight": {"insight_id": 765},"entities": [{"carc_id": 796,"representation": "category"}, {"carc_id": 345,"representation": "category"}, {"carc_id": 75,"representation": "category"}, {"carc_id": 350,"representation": "category"}],"filters": {"date_resolution": "day","location_resolution": ”us","date_range": {"start_date": "2024-01-01","end_date": "2025-09-11"},"transaction_method": "*”},aggregate": "sum"}
Exhibit 11:
{"insight": {"insight_id": 765},"entities": [{"carc_id": 949,"representation": "category"}, {"carc_id": 5,"representation": "category"}, {"carc_id": 924,"representation": "category"}, {"carc_id": 936,"representation": "category"}],"filters": {"date_resolution": "day","location_resolution": ”us","date_range": {"start_date": "2024-01-01","end_date": "2025-09-11"},"transaction_method": "*”},aggregate": "sum"}
Exhibit 12: Same as Exhibit 1
Exhibit 13: Same as Exhibit 2