Company Spotlight
Carbon Arc Data Assets: Credit Card – US Complete Panel, Foot Traffic, Digital Advertising, Clickstream, App Intelligence, Trade Claims, Freight Volume – North America, Mobile App, POS – Instore and Online
Growth Drivers, Tariffs, and the Sporting Goods Consumer
November 18, 2025
Executive Summary
After a strong start to the year and solid August for Dick’s Sporting Goods (DKS), consumption data available on the Carbon Arc platform shows stable momentum post-guide with solid ticket growth underpinning stable traffic trends. DKS reported earnings August 28th; the company beat estimates with 5.0% comp sales growth and raised full year guidance to 2.0-3.5% Y/Y. Since the print, spend growth has been flat, with 3-4% Y/Y ticket growth offset by transaction counts. Physical engagement improved Q/Q, driven by remodeled House of Sport stores, with digital engagement (clickstream and app) falling slightly.
Key Takeaways
-
Constant Shopper card spend at DKS ex-Foot Locker accelerated +1.8 pp Y/Y from 2QFY26 (+1.2 pp with Foot Locker included), suggesting continued topline momentum. However, spend acceleration has been ~flat since management’s last commentary on August 28.
-
Ticket growth in Carbon Arc’s card panel accelerated +1.5 pp to +3.6% Y/Y while transaction growth decelerated -0.1pp from 2Q26.
-
In the 14 days ending November 11, Carbon Arc constant shopper card spend was 1.8 pp above spend growth in 3Q26 (-4.2% vs. -6.0%), suggesting sales momentum continued into 4Q. The gap between transactions and spend growth continued to expand, indicating additional ticket growth.
-
Foot traffic growth in House of Sport zip codes accelerated from 2Q26 and outgrew total foot traffic for Dick’s for the 9th consecutive quarter, but instore and online card spend growth was slower in areas near a House of Sport.
-
Online sales continued to outperform as web and app users grew Y/Y for a second consecutive quarter, though engagement metrics are weaker entering 4Q26.
-
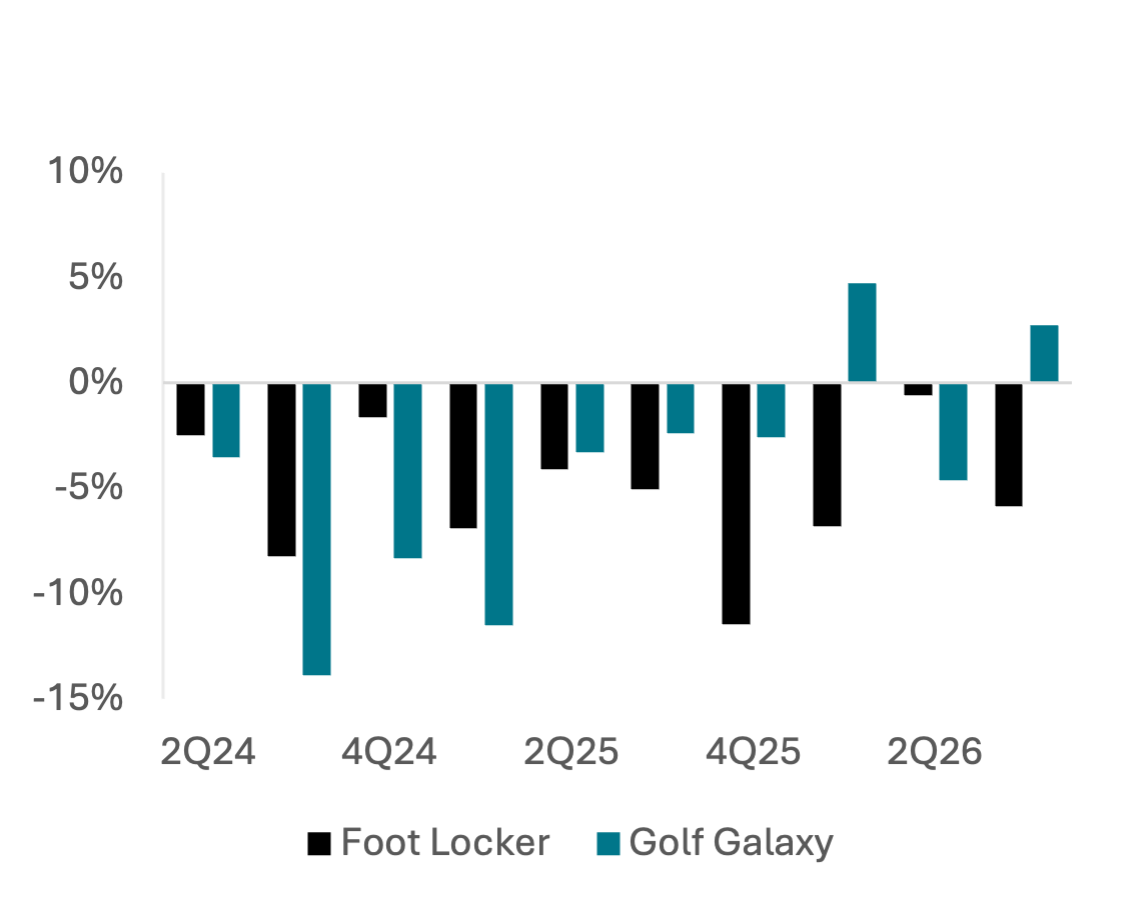
At Foot Locker, spend growth decelerated vs. 2Q26 despite a slight acceleration in basket size as foot traffic continued to decline Y/Y. Transaction frequency and foot traffic accelerated at Golf Galaxy though basket size declined Y/Y.
-
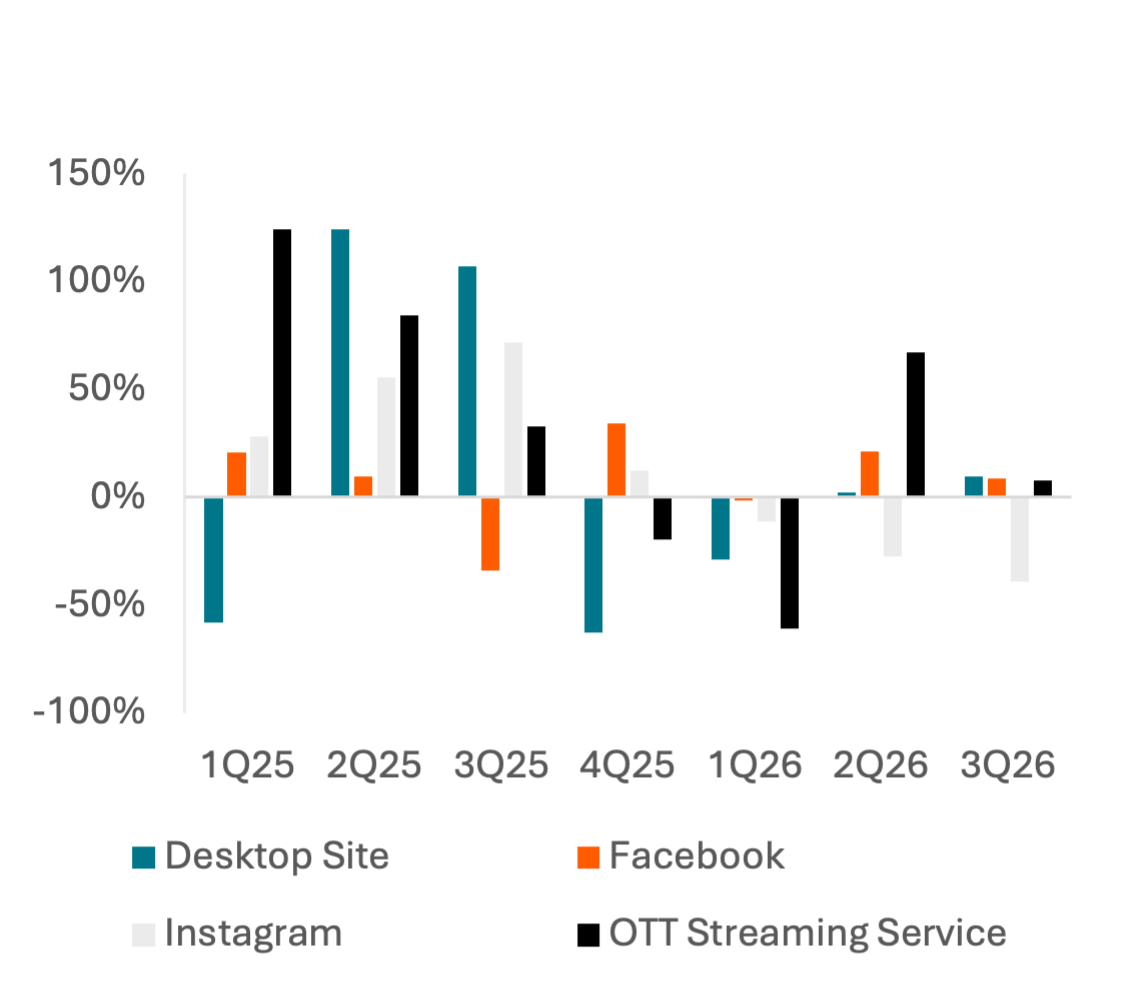
Online engagement metrics grew significantly Y/Y for Dick’s Sporting Goods, Foot Locker, and Golf Galaxy earlier in FY26 but are decelerating entering 4Q26.
-
Freight and trade claims data indicates acceleration in supply chain activity following significant Y/Y declines earlier in 2025.
Top-Line Sales and Momentum
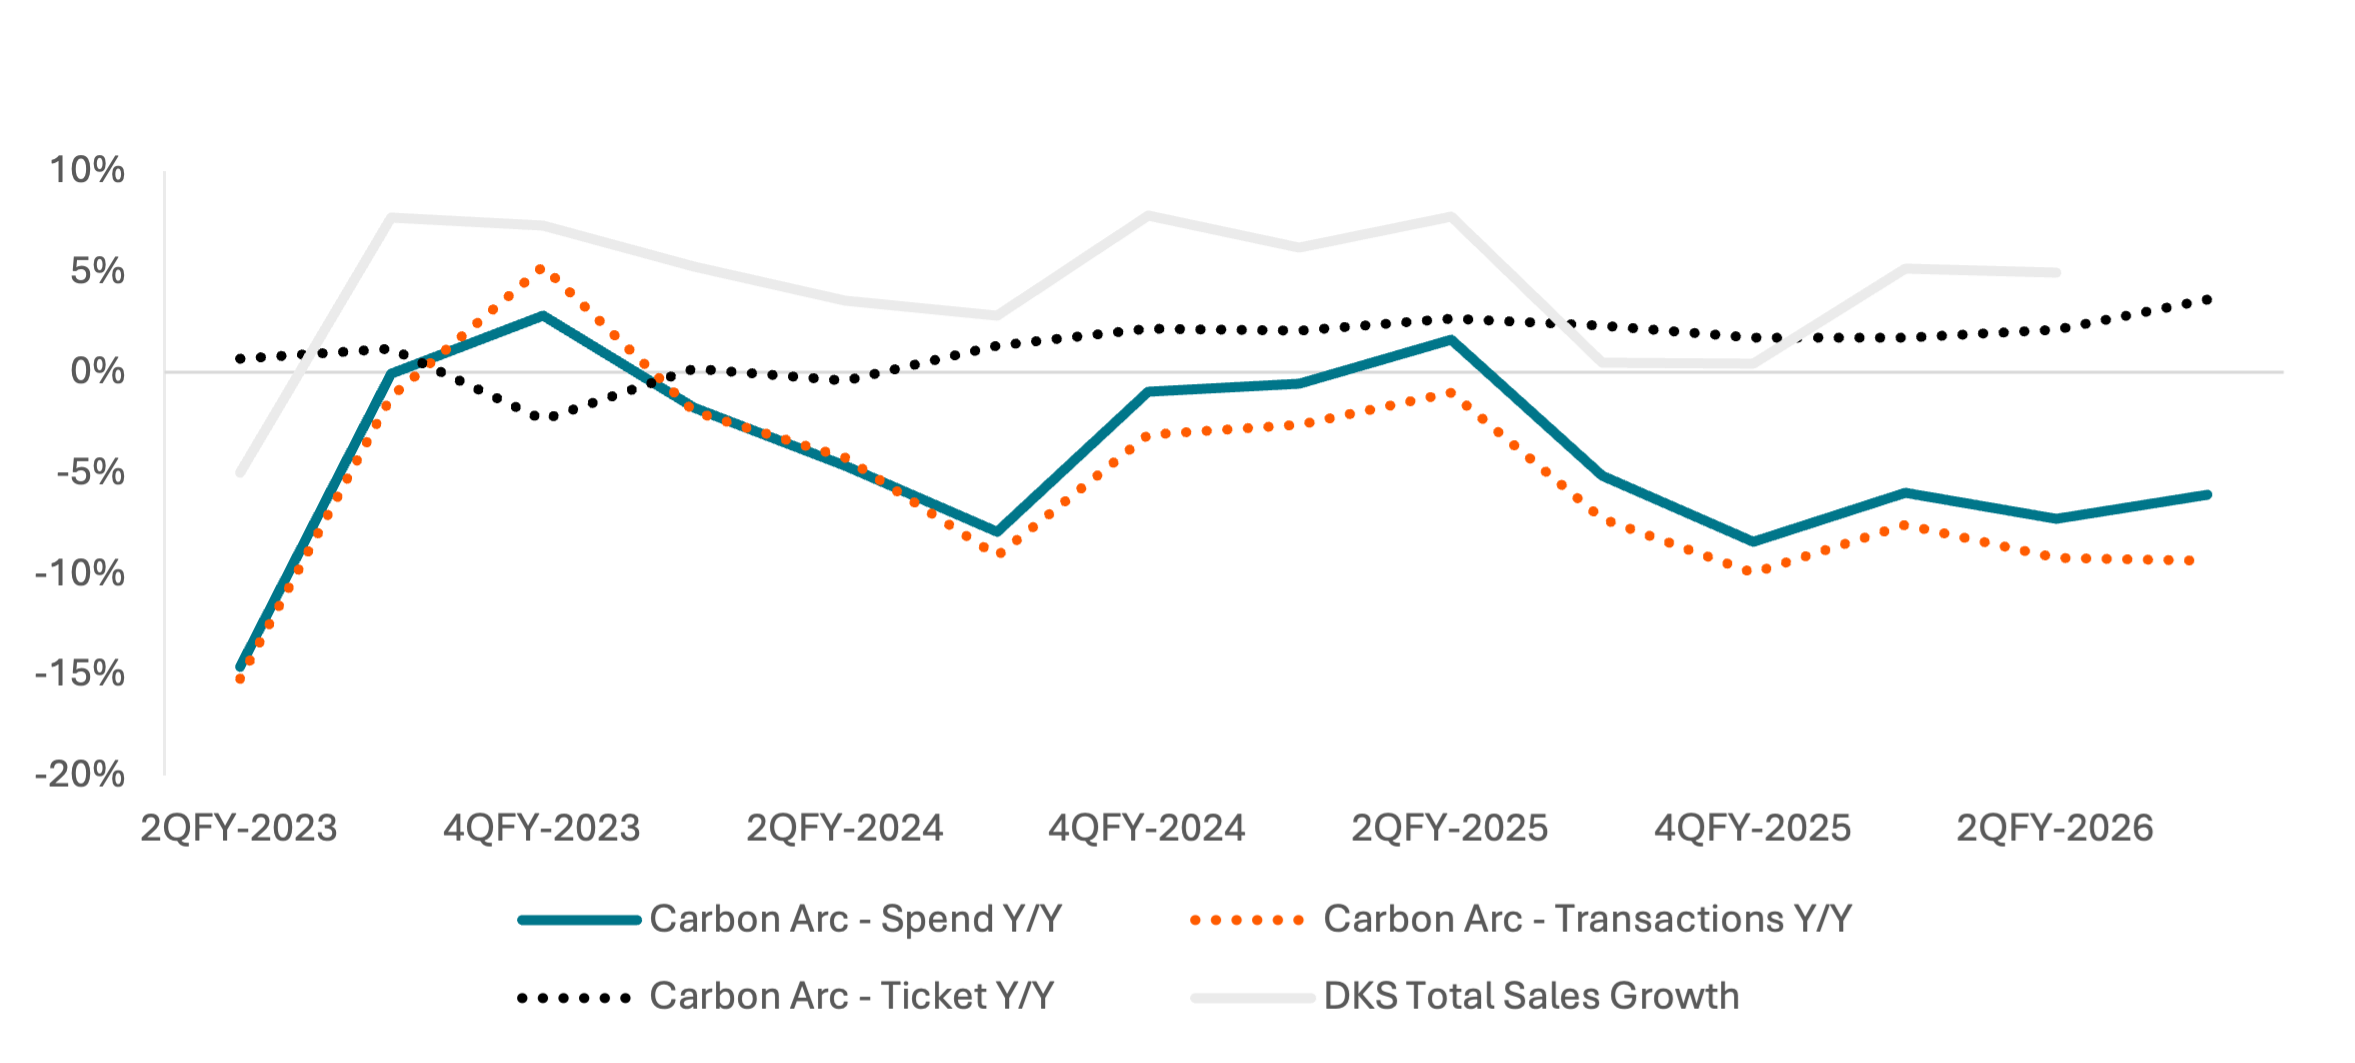
Carbon Arc credit card data shows a +1.2 pp acceleration in total sales for DKS in 3QFY26 (+1.8 pp ex-Foot Locker), suggesting DKS total sales growth of +6.2% - +6.8% with a backtest standard deviation of +/- 1.0%. In their 2Q earnings report, DKS increased comp store sales guidance to 2.0 – 3.5% Y/Y, remaining conservative despite quarterly sales growth of +4.5% and +5.0% in 1Q and 2Q. Like 2Q, ticket was the primary driver of growth, with ticket growth in Carbon Arc’s panel accelerating 1.5 pp to +3.6% Y/Y in 3Q, vs. a -0.1 pp deceleration in transaction frequency.
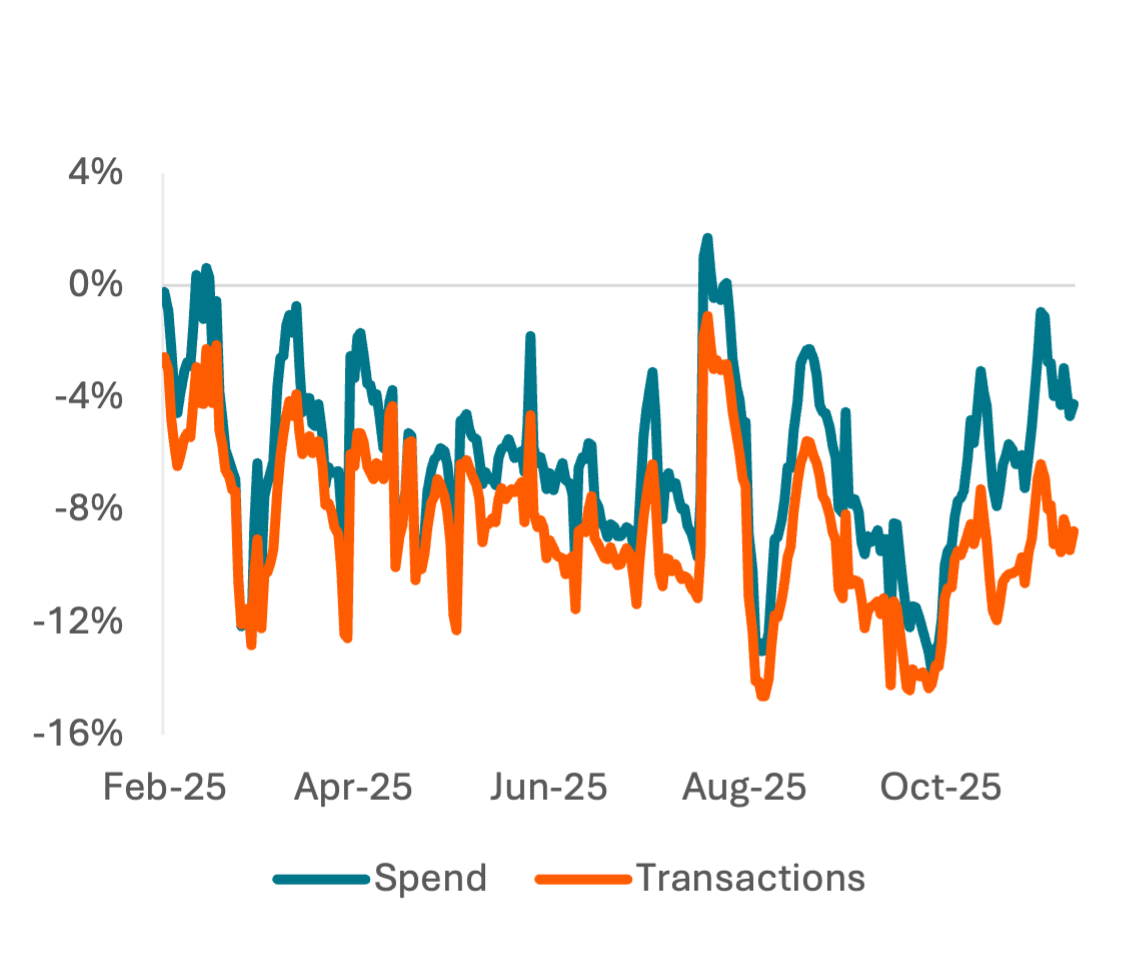
Daily card spend data shows DKS entering FY4Q with stronger momentum with -4.2% Y/Y card spend growth in the 14 days ending November 11, vs. -6.0% panel growth in FY3Q. Transaction growth remains in-line with the FY3Q average, indicating ticket size is driving the early growth.
Spend and transactions growth rallied during the early part of the back-to-school season, with a peak in the 14 days ending August 21, but was significantly weaker in late August and September before late-quarter acceleration.
Exhibit 1: DKS Total Sales Growth vs. Carbon Arc Credit Card – US Complete Constant Shopper Panel
Price: 23.42 Tokens
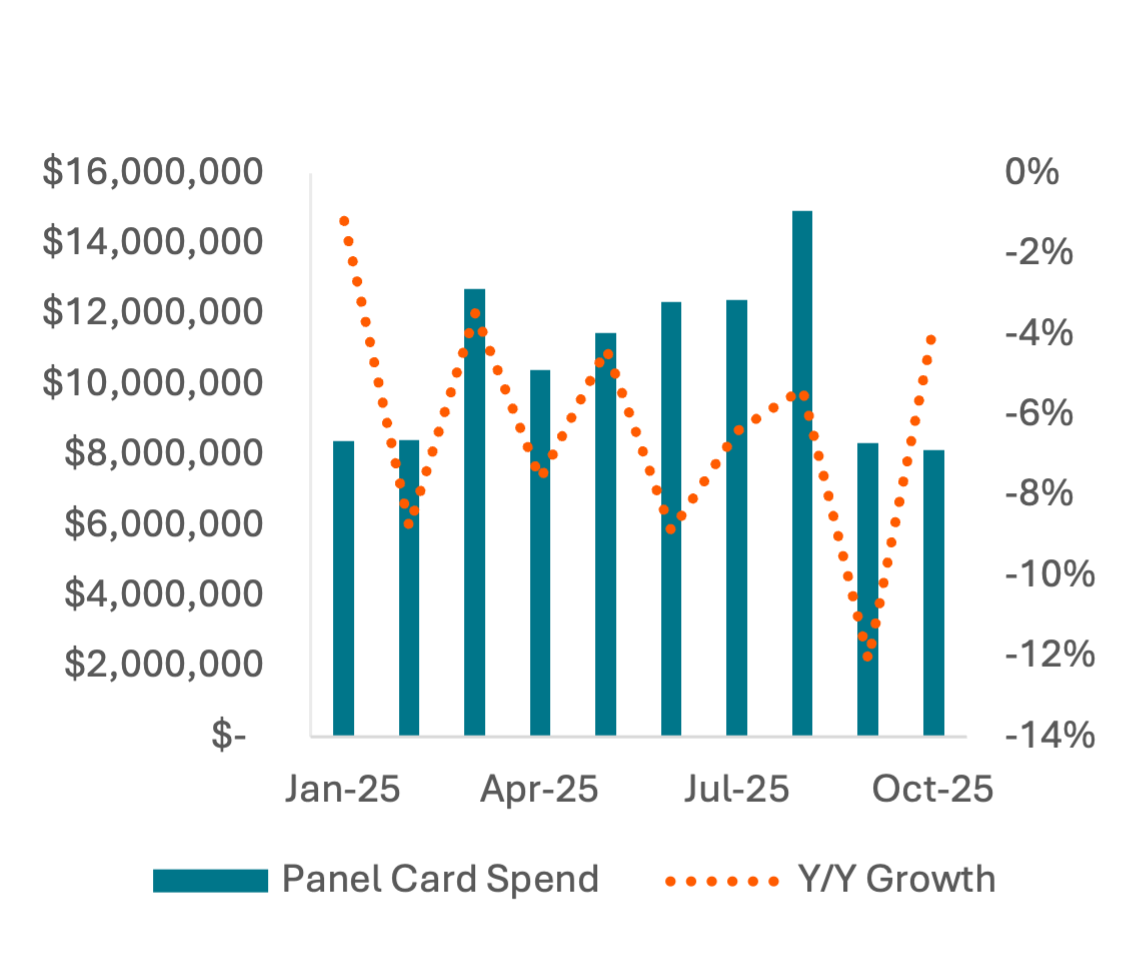
Exhibit 2: DKS Monthly Credit Card Panel Spend
Price: 6.19 Tokens
Exhibit 3: DKS Trailing 14-Day Card Spend and Transaction Growth Y/Y
Price: 12.38 Tokens
Foot Traffic and Banner Brand Sales Channels
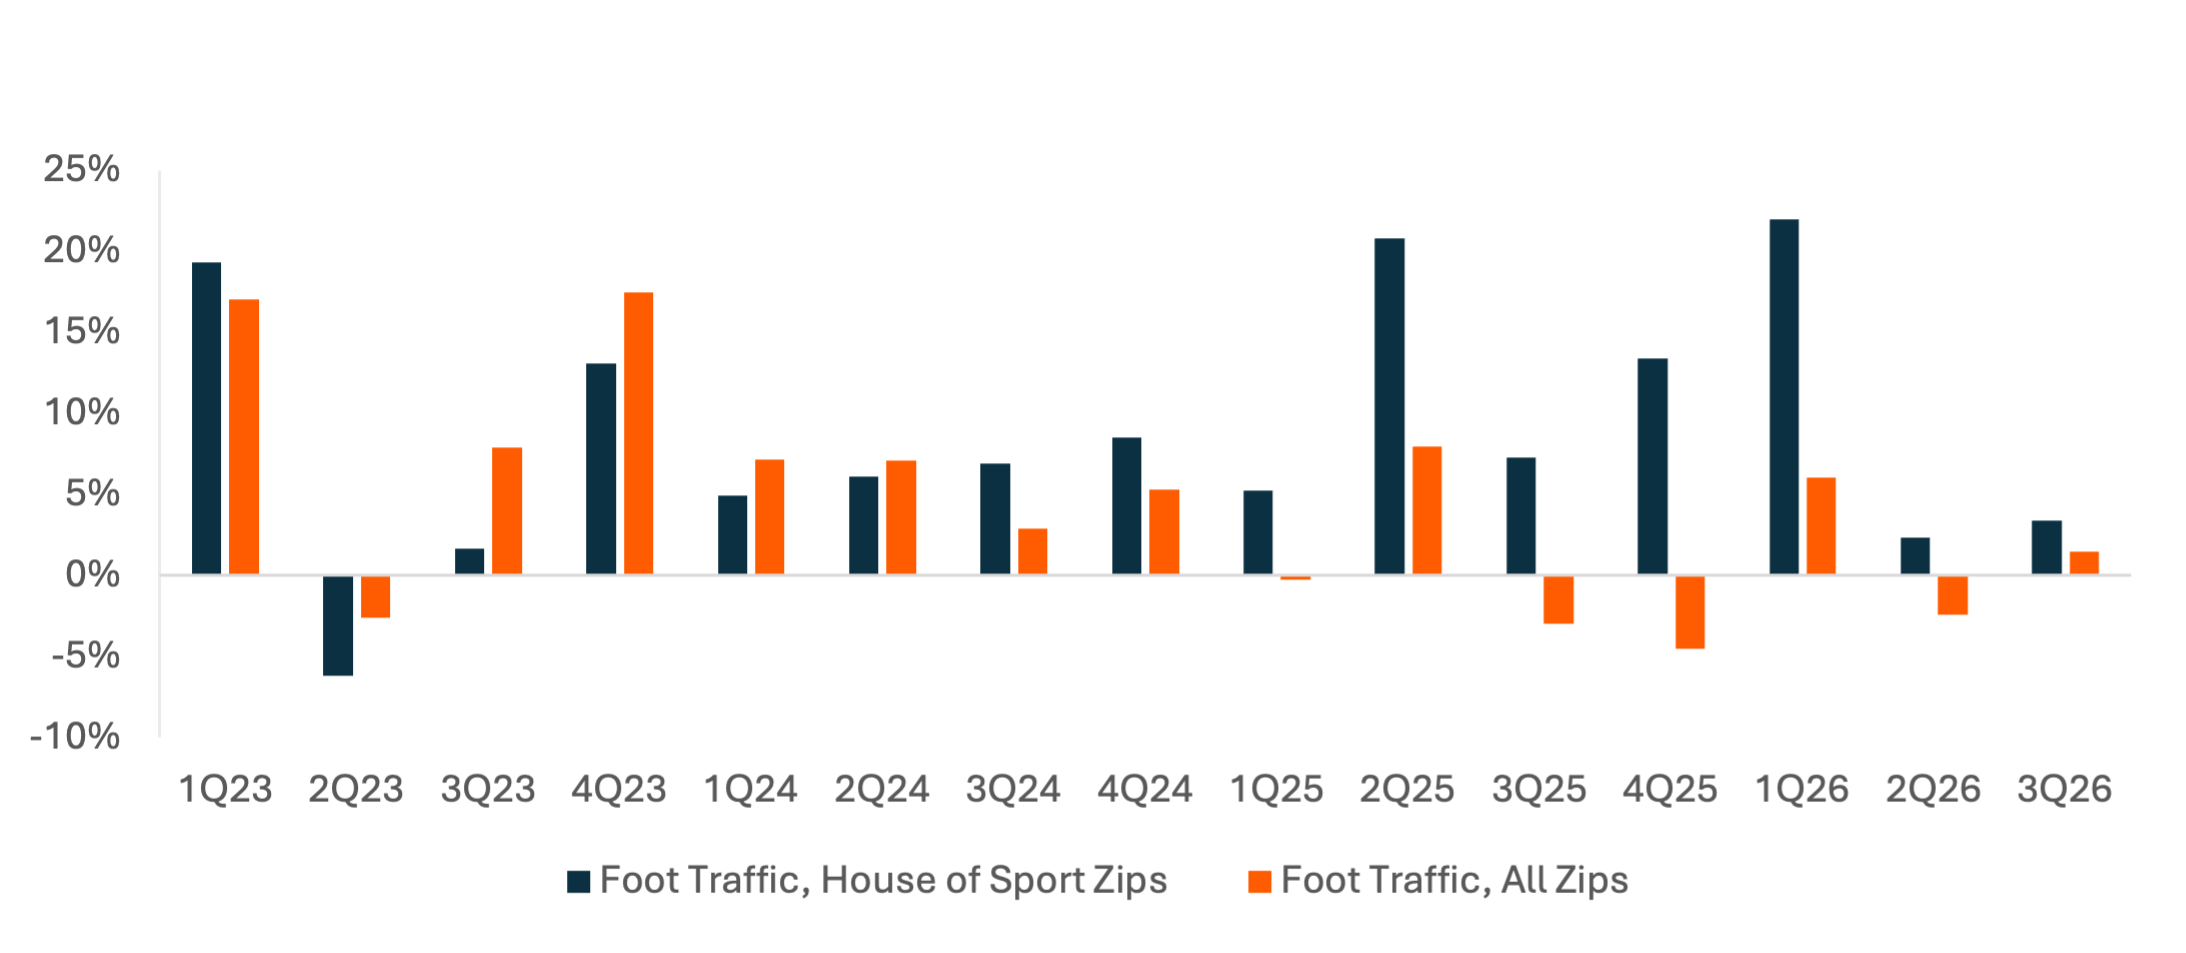
Foot traffic at Dick’s grew +1.5% Y/Y after Y/Y declines in 3 of the last 4 quarters, driven by continued outperformance by House of Sport locations. Zip codes containing a House of Sport have grown foot traffic faster than the Dick’s brand for 9 consecutive quarters, though the performance gap is shrinking from FY25 to FY26.
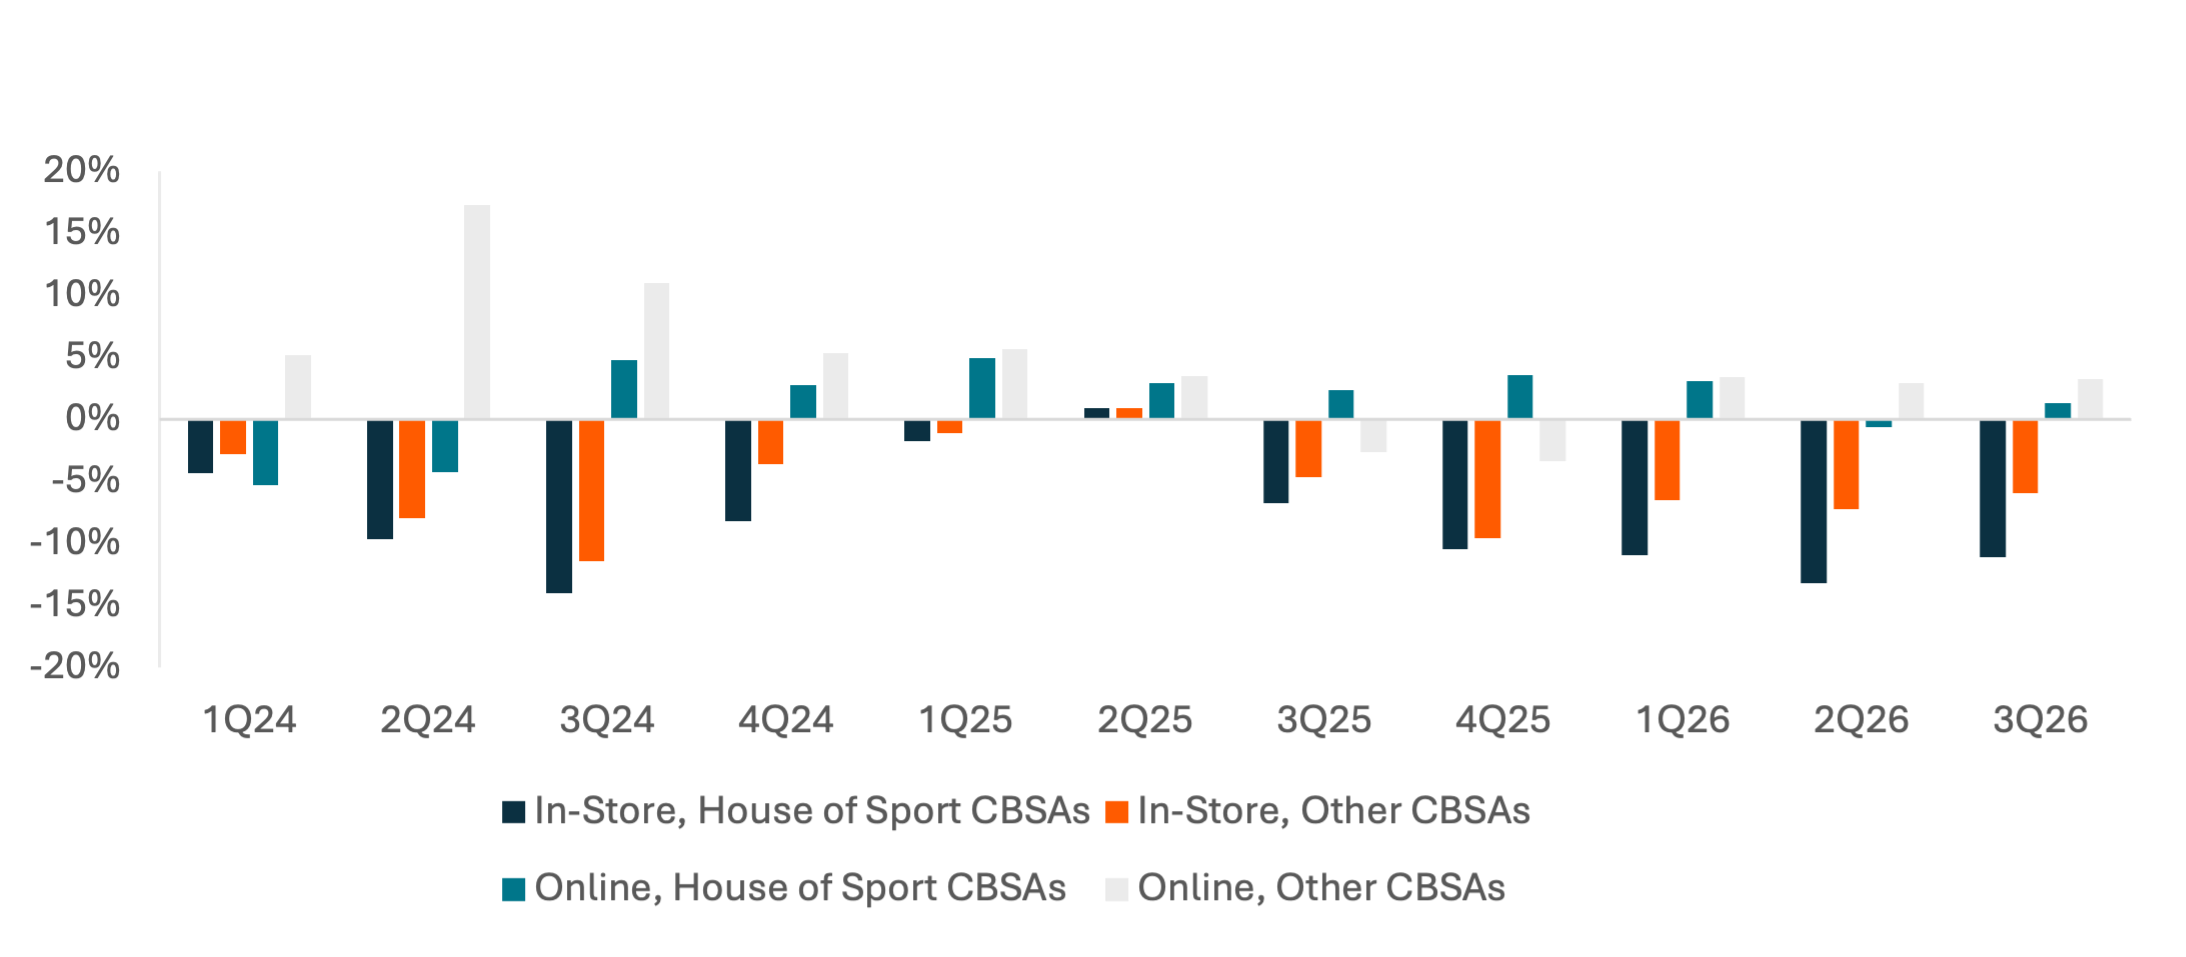
However, card spend indicates that the increased traffic to House of Sport stores is not driving in-store sales growth. CBSAs (Core-Based Statistical Areas, similar in size to a county) with a House of Sport have trailed non-House of Sport CBSAs in spend growth for 5 consecutive quarters. House of Sport stores may have grown online transactions faster in 2H24 but consumers near a House of Sport or also transacting less frequently online.
Exhibit 4: Dick’s Foot Traffic Y/Y Growth in House of Sports Zips vs. Brand Baseline
Price: 725.54 Tokens
Exhibit 5: Dick’s Card Spend Y/Y Growth by Channel
Price: 2848.55 Tokens
Foot Locker and Golf Galaxy
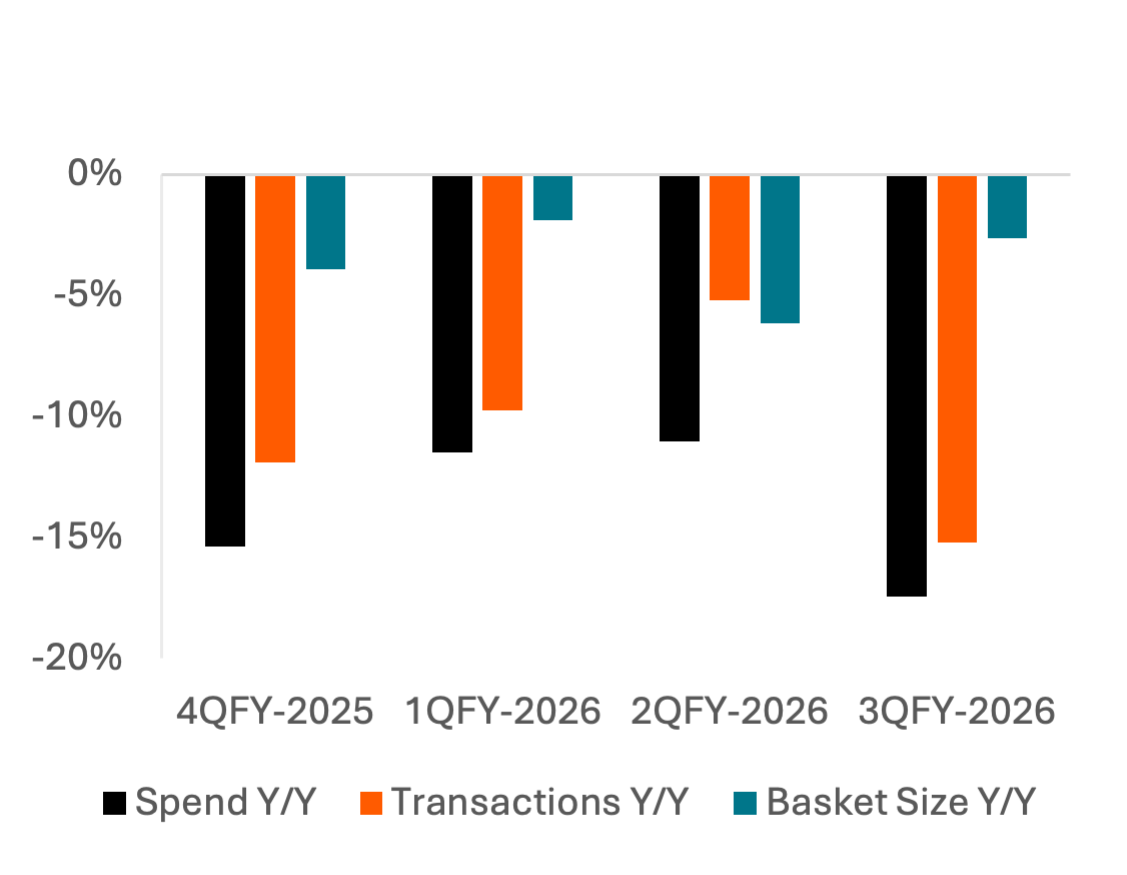
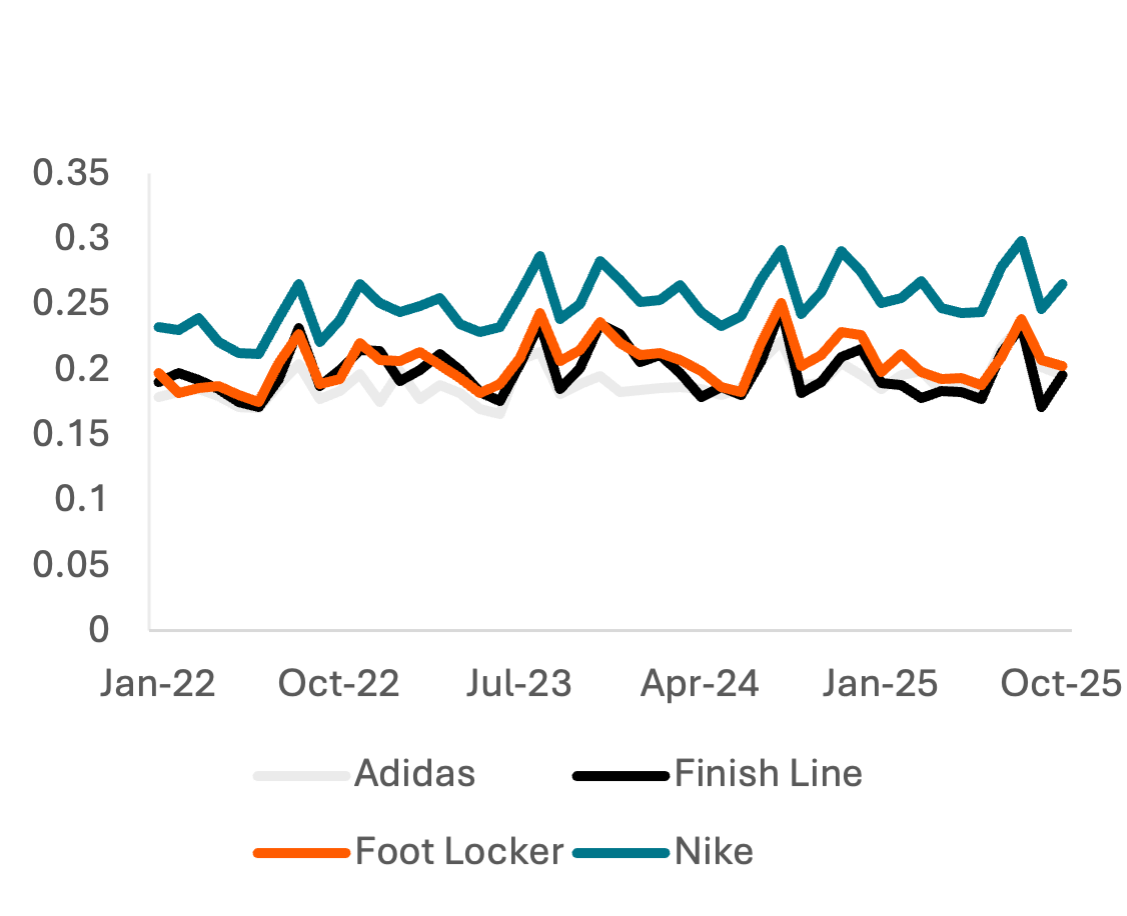
Among the other primary brands in DKS’s portfolio, Foot Locker card spend decelerated -6.4 pp in 3Q despite a +3.5 pp ( -6.1% to -2.6%) acceleration in average basket size. Panel transactions decelerated -10 pp to -15.2% Y/Y. Some of the deceleration may be driven by Foot Locker’s plan to close 100 North America stores in 2025, making comps store sales estimates difficult, but the deceleration implies -11.2% total sales growth with a wide margin of error (standard deviation of 3.9%). Foot traffic also decelerated substantially from FY2Q for a 10th consecutive Y/Y decline but remains above the levels seen in card spend, at -5.8% Y/Y. Card spend overlap PMI Score, on a -1 to 1 scale where 0 represents random, independent probability, shows that Foot Locker has above-expected overlap with Dick’s Sporting Goods, which could increase the challenge of improving Foot Locker sales without cannibalizing Dick’s own footwear business. However, overlap is still lower than for Nike and in-line with Adidas and Finish Line.
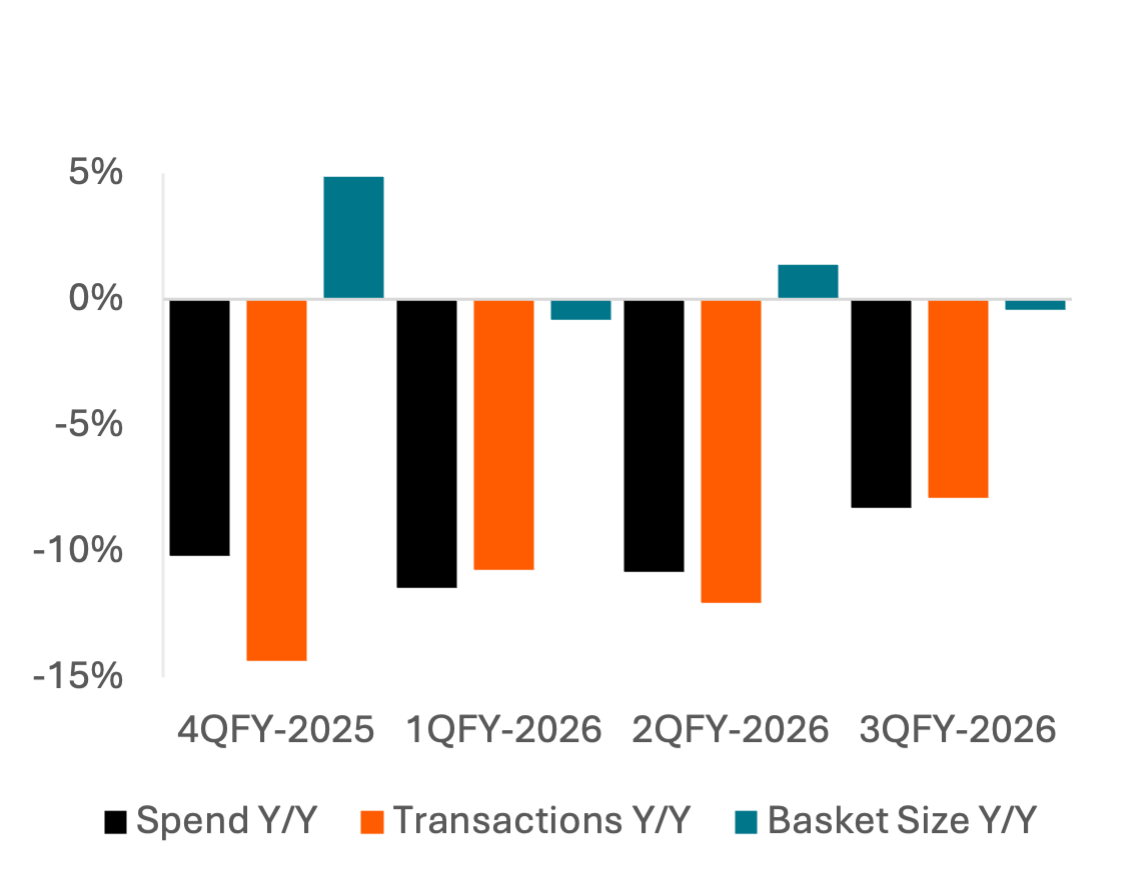
At Golf Galaxy, basket size decelerated 1.8 pp to -0.4% Y/Y but transactions accelerated +4.1 pp, suggesting acceleration from last quarter’s comp sales of +1.8% Y/Y. Foot traffic accelerated 7 pp, in-line with the improvement in transaction frequency, demonstrating a general recovery in FY26 following significant declines in FY24 – FY25.
Exhibit 6: Foot Locker Card Spend Growth
Price: 7.60 Tokens
Exhibit 7: Golf Galaxy Card Spend Growth
Price: 7.60 Tokens
Exhibit 8: Normalized PMI Score for Customer Overlap between Dick’s Sporting Goods and Footwear Retailers
Price: 4.99 Tokens
Exhibit 9: Foot Traffic Y/Y Growth by Brand
Price: 54.86 Tokens
Digital Engagement and Advertising
After more-significant increases in FY25, digital advertising spend by DKS has been ~flat across most platforms in FY26, with spend on Instagram decelerating for 4 consecutive quarters.
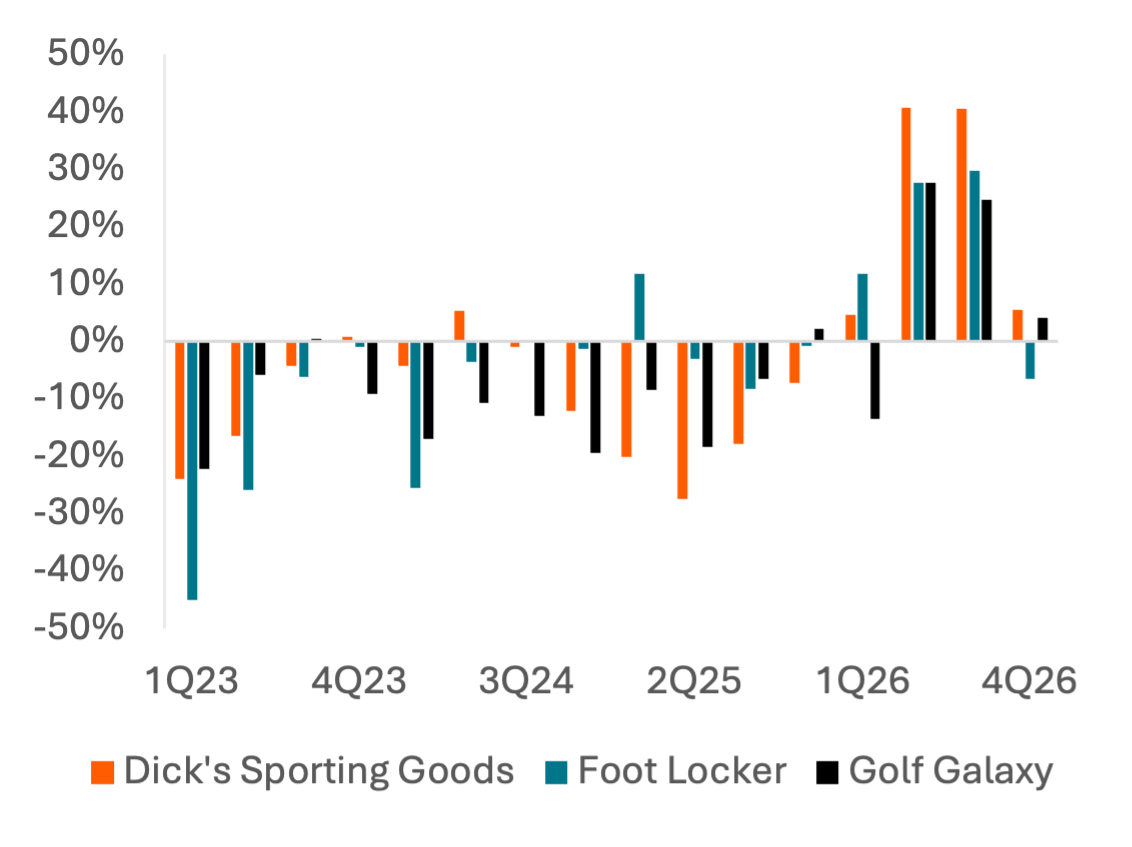
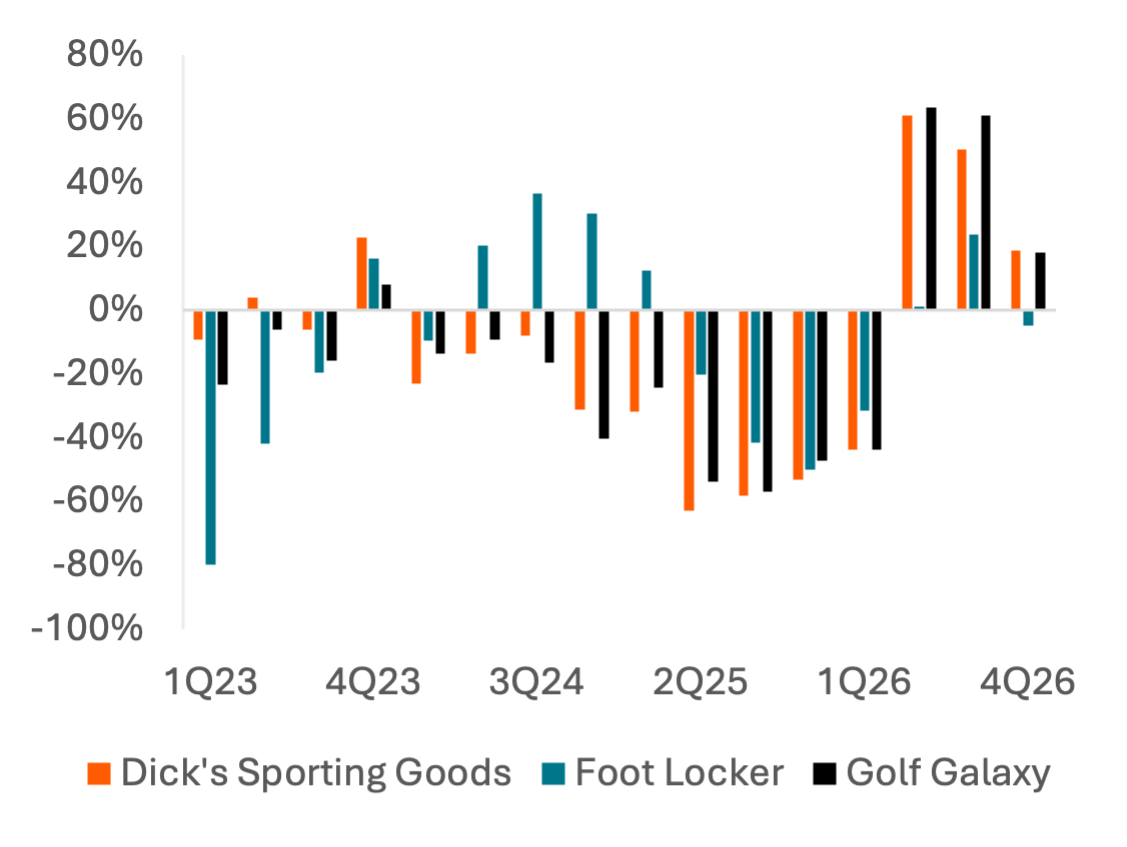
Despite the lower digital spend, web and app engagement has been rising for DKS in FY26. Web DAUs grew Y/Y for the company’s three largest brands (including Foot Locker pre-acquisition) in 2Q and 3Q, with traffic growing faster than DAUs for Dick’s Sporting Goods and Golf Galaxy, indicating longer or more frequent sessions.
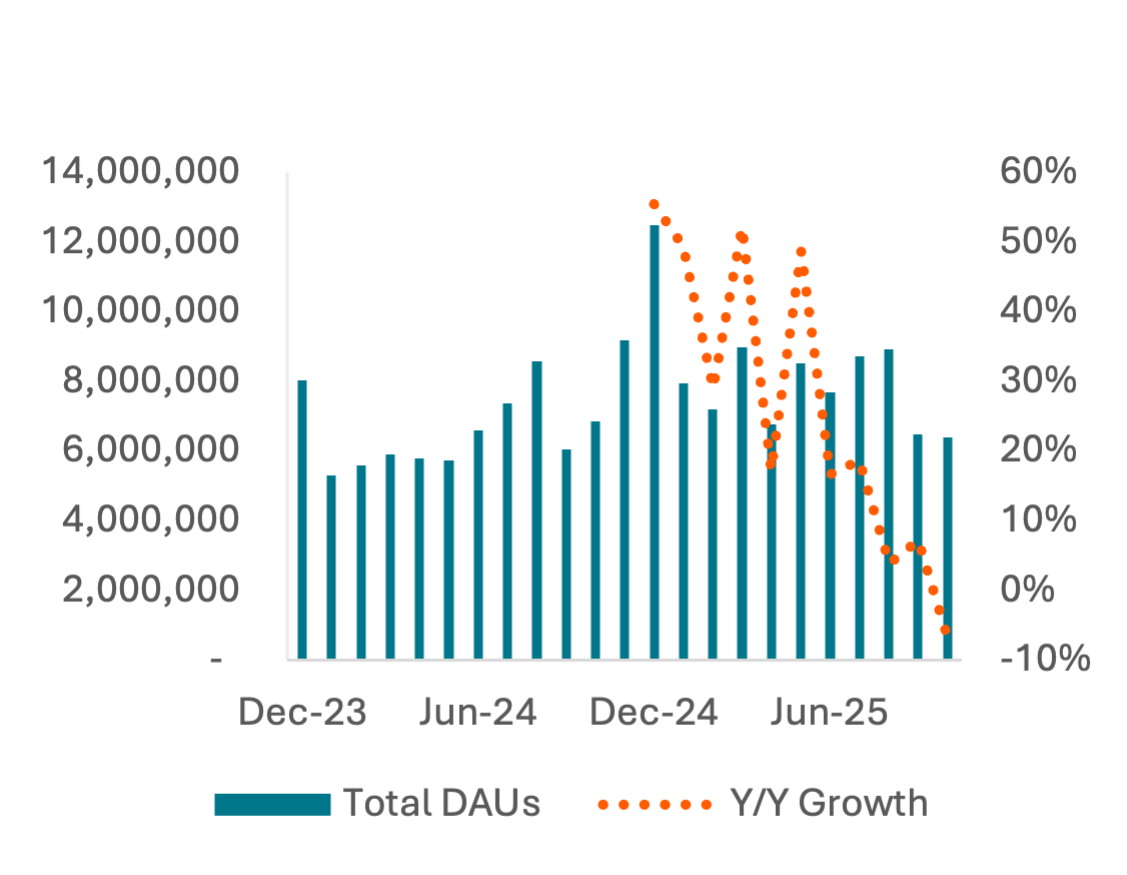
App usage grew substantially throughout 2024 as DAUs reached a peak during the holiday shopping season in November and December 2024. Y/Y growth in app users gradually decelerated following its peak of 56% growth in December 2024, reaching negative values in October after positive growth earlier in 3Q.
Web activity shows similar autumn weakness, with QTD traffic and DAUs decelerating substantially across brands, though trends could easily reverse during the holiday shopping season.
Exhibit 10: DKS Digital Advertising Y/Y Growth
Price: 5.45 Tokens
Exhibit 11: Normalized Daily Web Users Y/Y Growth
Price: 8.62 Tokens
Exhibit 12: Normalized Web Traffic Y/Y Growth
Price: 8.62 Tokens
Exhibit 13: Dick’s Total Daily App Users by Month
Price: 48.54 Tokens
Additional Category Inflation Insights
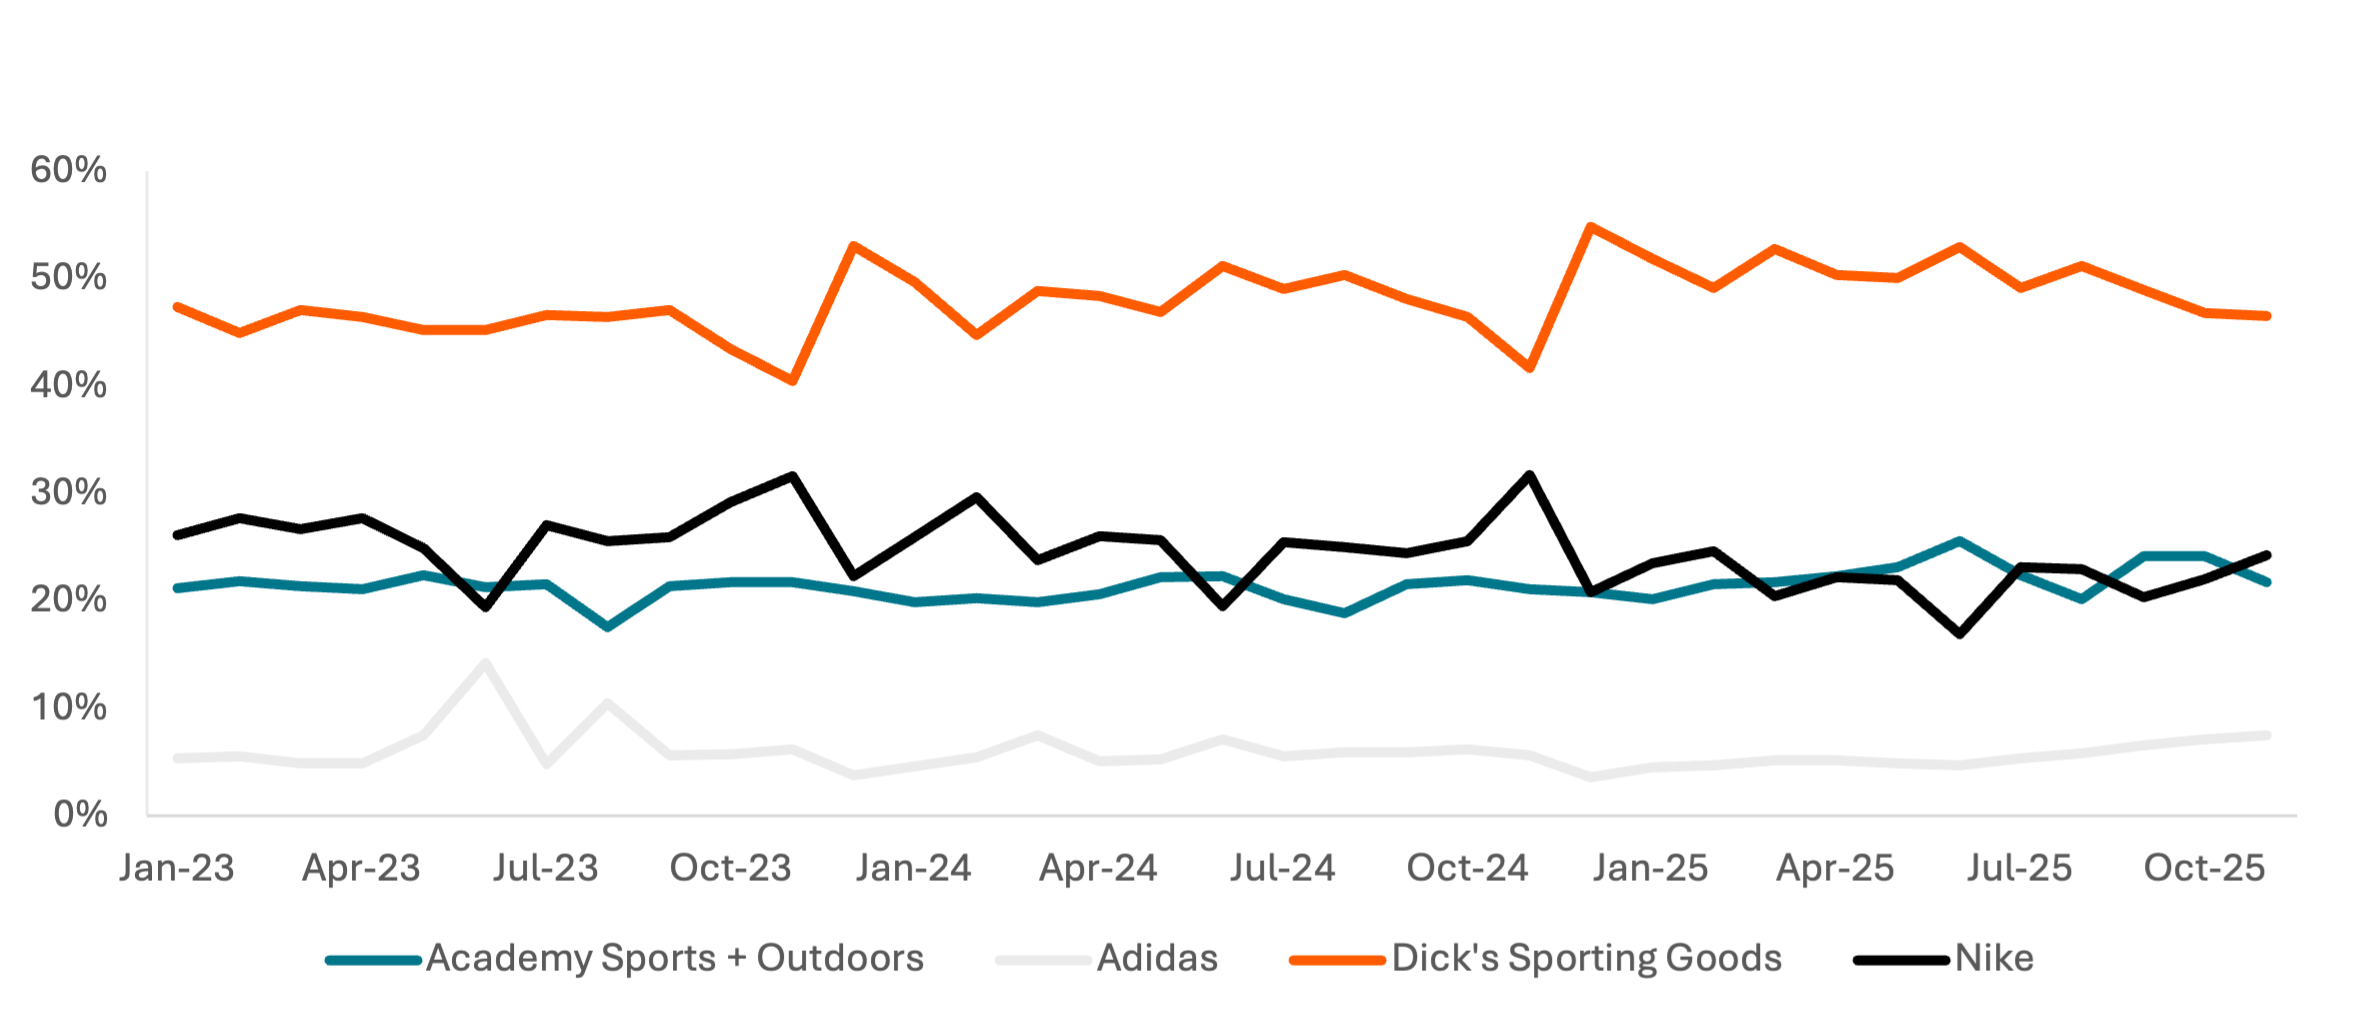
DKS’s solid results in a challenging environment coincides with the banner brand gaining market share against other sporting goods and apparel retail options in 2024 and 2025. Nike has been losing ground to both Dick’s and Academy Sports + Outdoors, suggesting either an increase in spend on hardlines or consumer preferences shifting against Nike. Dick’s direct market share against Academy Sports fell Y/Y in the summer but has recovered to 2024 levels this fall, ahead of what is typically Dick’s strongest month of the year. The lower spend share in November suggests Black Friday / Cyber Monday is less important to its overall performance.
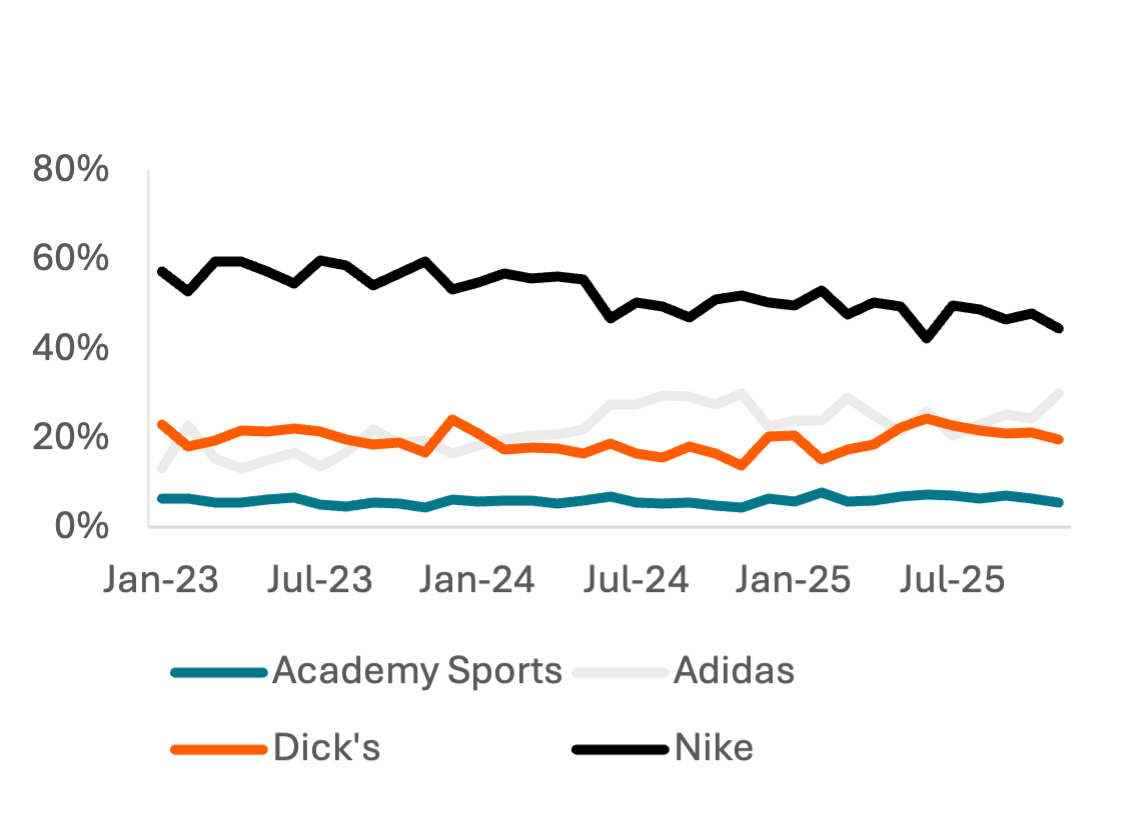
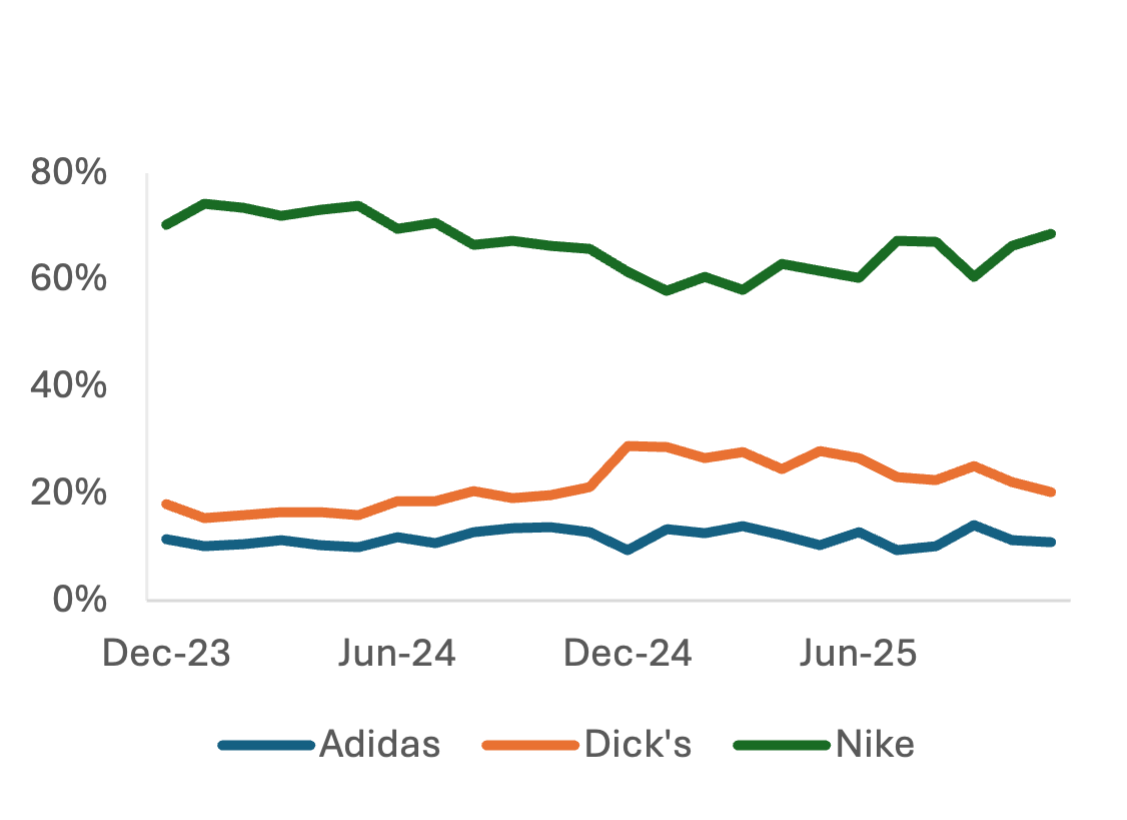
Nike has also lost significant app usage and web traffic share in the last 2 years. Web traffic shifted to Adidas in 2024 and then Dick’s in 2025, after Dick’s also lost share to Adidas in 2024. Dick’s app usage share peaked in December 2024 and has gradually declined alongside its total growth rate declining. Nike’s domination of web traffic and app usage can be attributed to limited-edition shoes and other apparel drops limited to DTC sales, as Adidas doesn’t receive the same boost despite similar DTC and sell-through structure. Dick’s growth in these attention channels while offering a greater brick-and-mortar footprint and lacking the same attention-grabbing opportunities is a further indication of a strong online footprint and loyalty program.
Exhibit 14: Credit Card Spend Market Share
Price: 36.97 Tokens
Exhibit 15: Web Traffic Market Share
Price: 11.91 Tokens
Exhibit 16: Retail App DAUs Market Share
Price: 145.61 Tokens
Tariff Challenges and Supply Chains
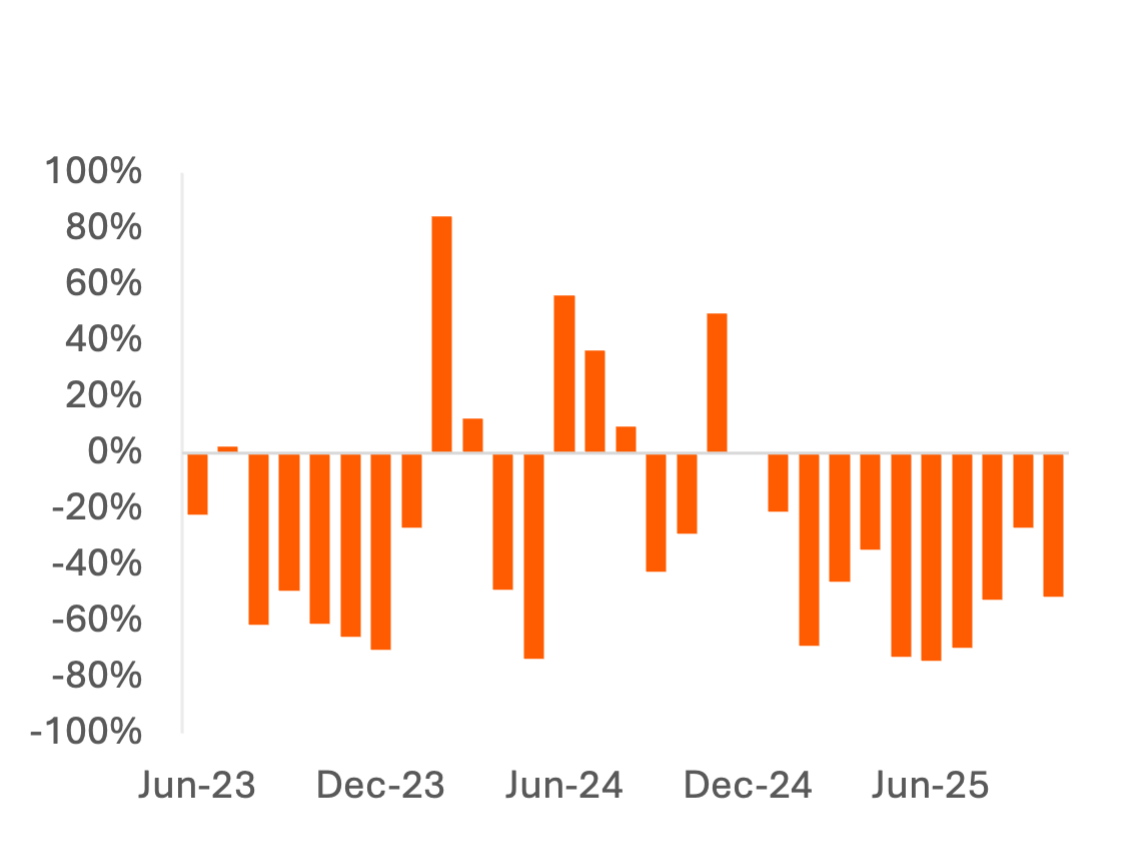
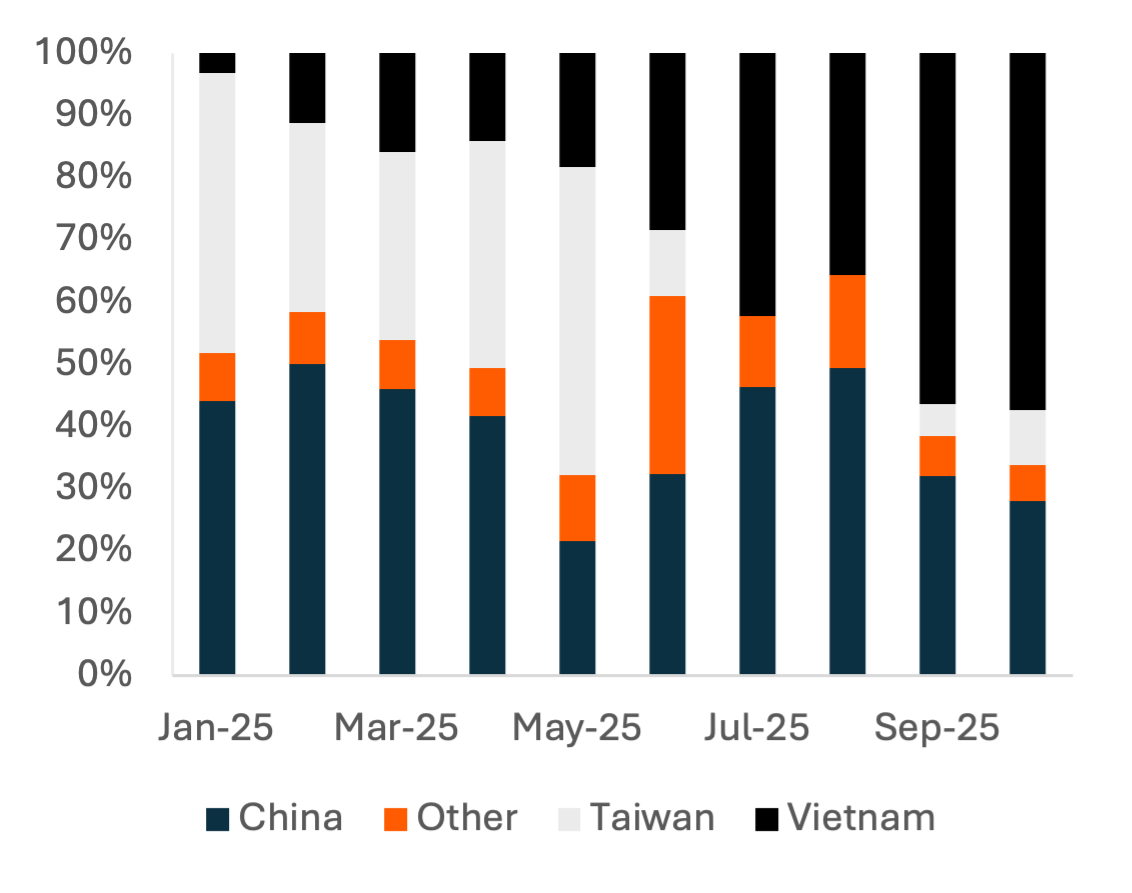
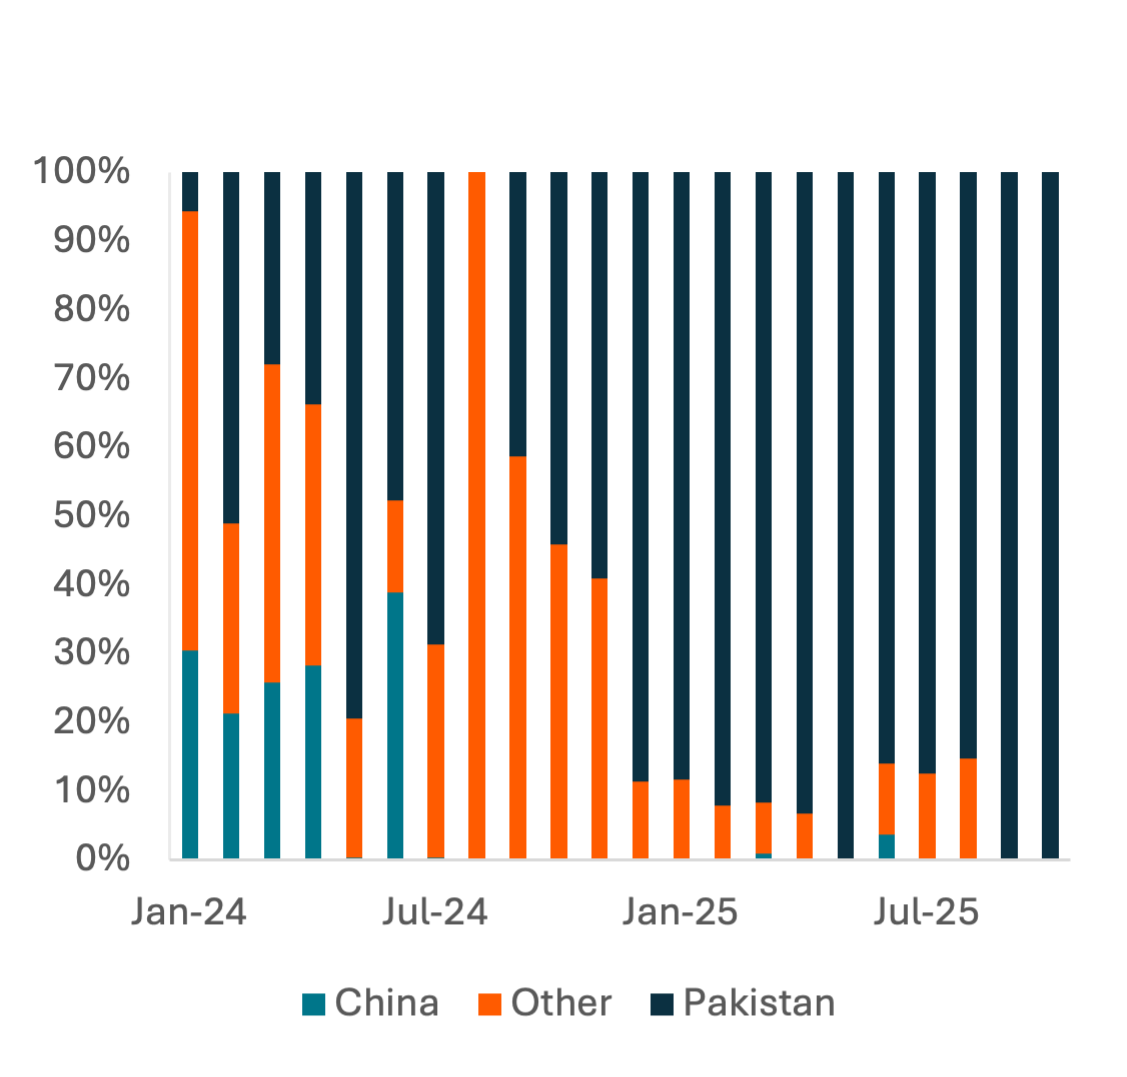
After relatively even growth in 2024, direct imports by Dick’s Sporting Goods decreased substantially in 2025. Dick’s also substantially increased its share of imports from Vietnam and decreasing imports from Taiwan, despite higher tariffs on Vietnam earlier in 2025. Foot Locker concluded its direct imports from China in 2024. In 2025, imports from Cambodia, Indonesia, and Vietnam have also decreased in favor of imports from Pakistan, which again has a 19% tariff.
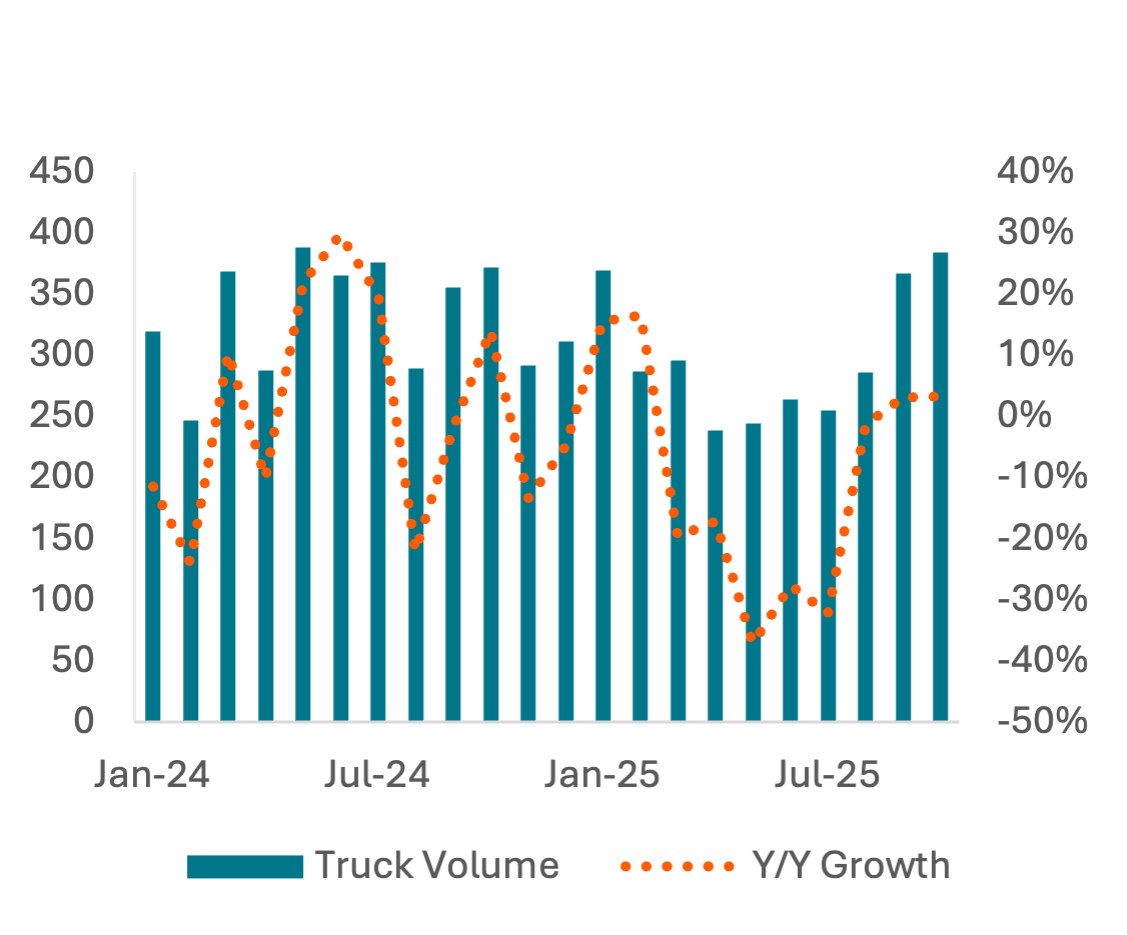
Outbound truck volume for Elmira, NY, which encompasses Dick’s nearby distribution and fulfillment facility in Conklin, NY, shows freight recovering to LSD growth Y/Y after a significant downturn in the spring and summer of 2025.
Exhibit 17: Dick’s (Retail Brand) U.S. Import Value Y/Y Growth
Price: 1534.11 Tokens
Exhibit 18: Dick’s Import Share by Country
Price: 1534.11 Tokens
Exhibit 19: Elmira, NY (including Conklin, NY) Outbound Truck Volume
Price: 4.99 Tokens
Exhibit 20: Foot Locker Import Share by Country
Price: 4.99 Tokens
Exhibit 21: U.S. Import Value by HS Category Y/Y Growth
Price: 1633.06 Tokens
Health of the Sporting Goods Consumer
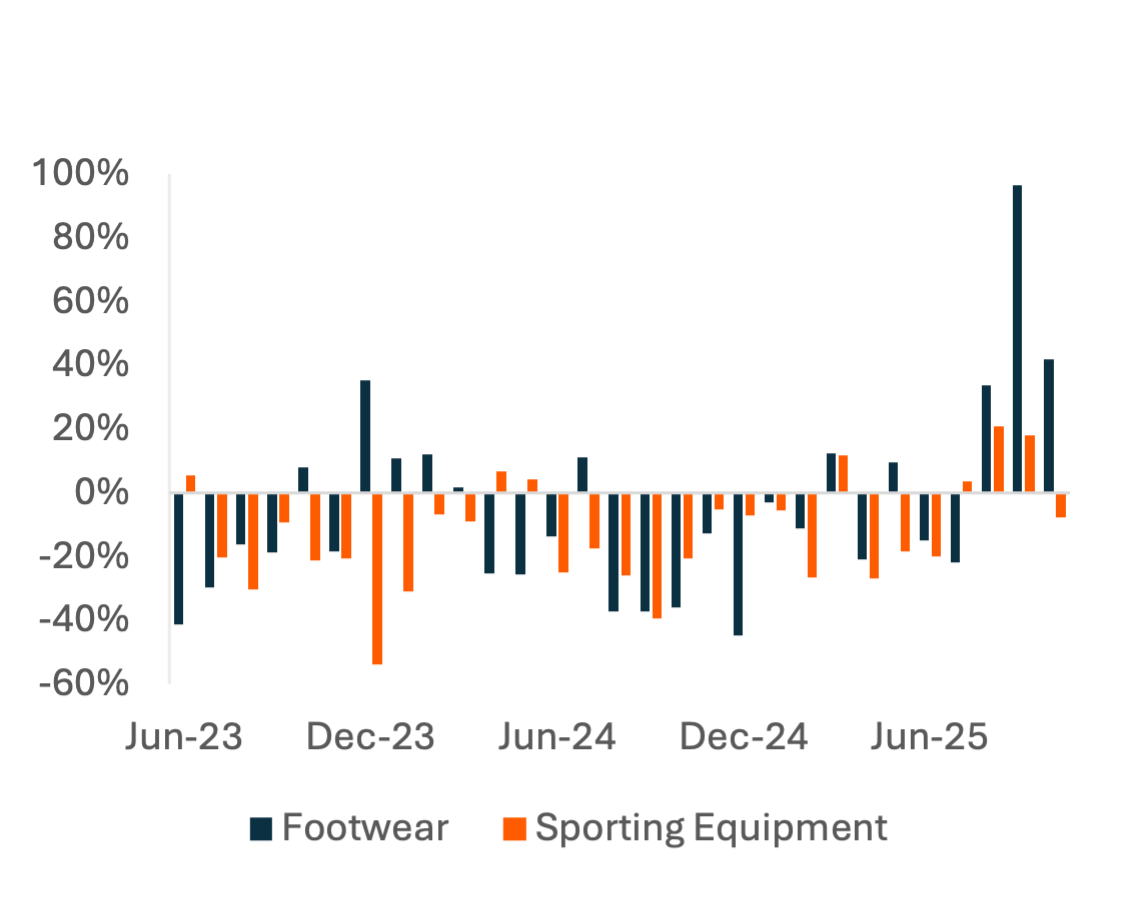
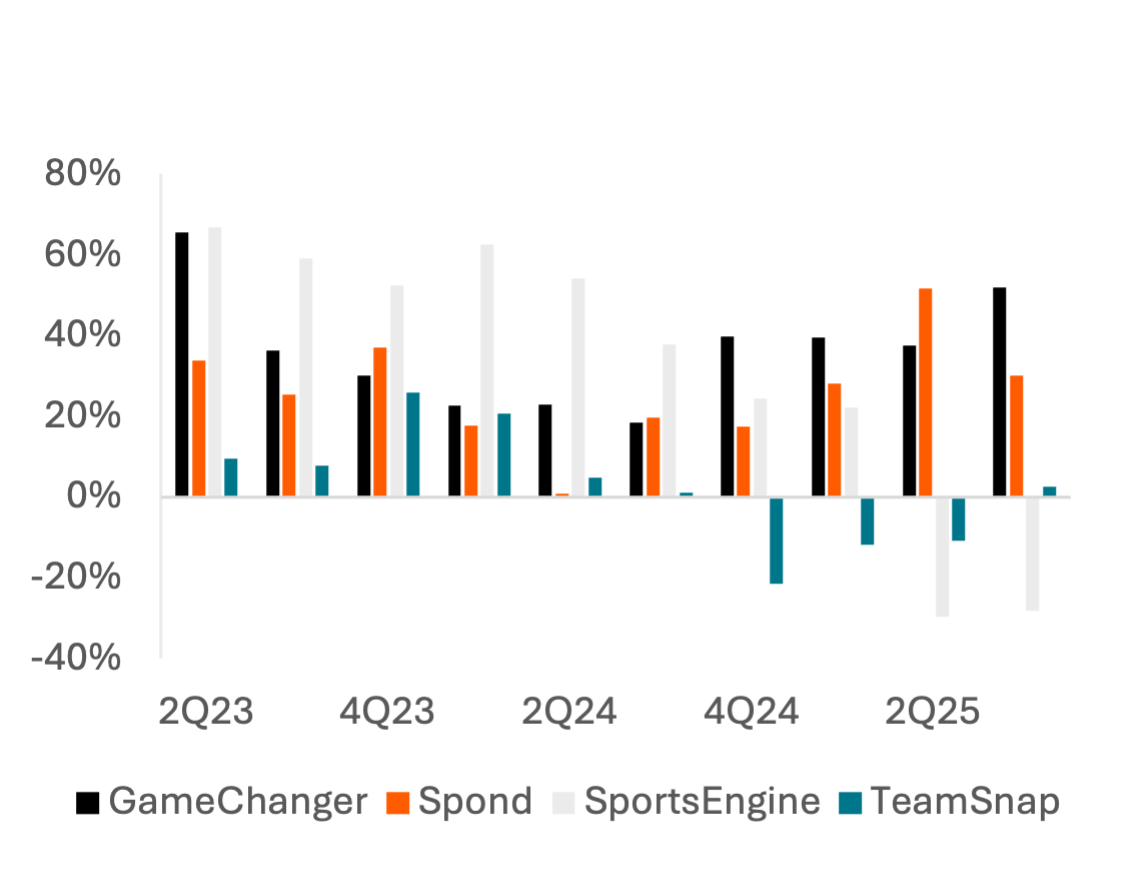
Dick’s recent performance may be buoyed by growth in youth sports and athletic involvement post-covid. App data shows activity on apps for youth sports scheduling and communication growing consistently in 2H23 and 2024, with mixed app performance in 2025 suggesting a gradual slowdown. Those signs of a slowdown are corroborated by POS data at mass merchandisers; normalizing the panel based on the total value of submitted receipts shows that consumers are using less of their basket on sporting goods in 2025 after ~flat to positive Y/Y growth in all months of 2024.
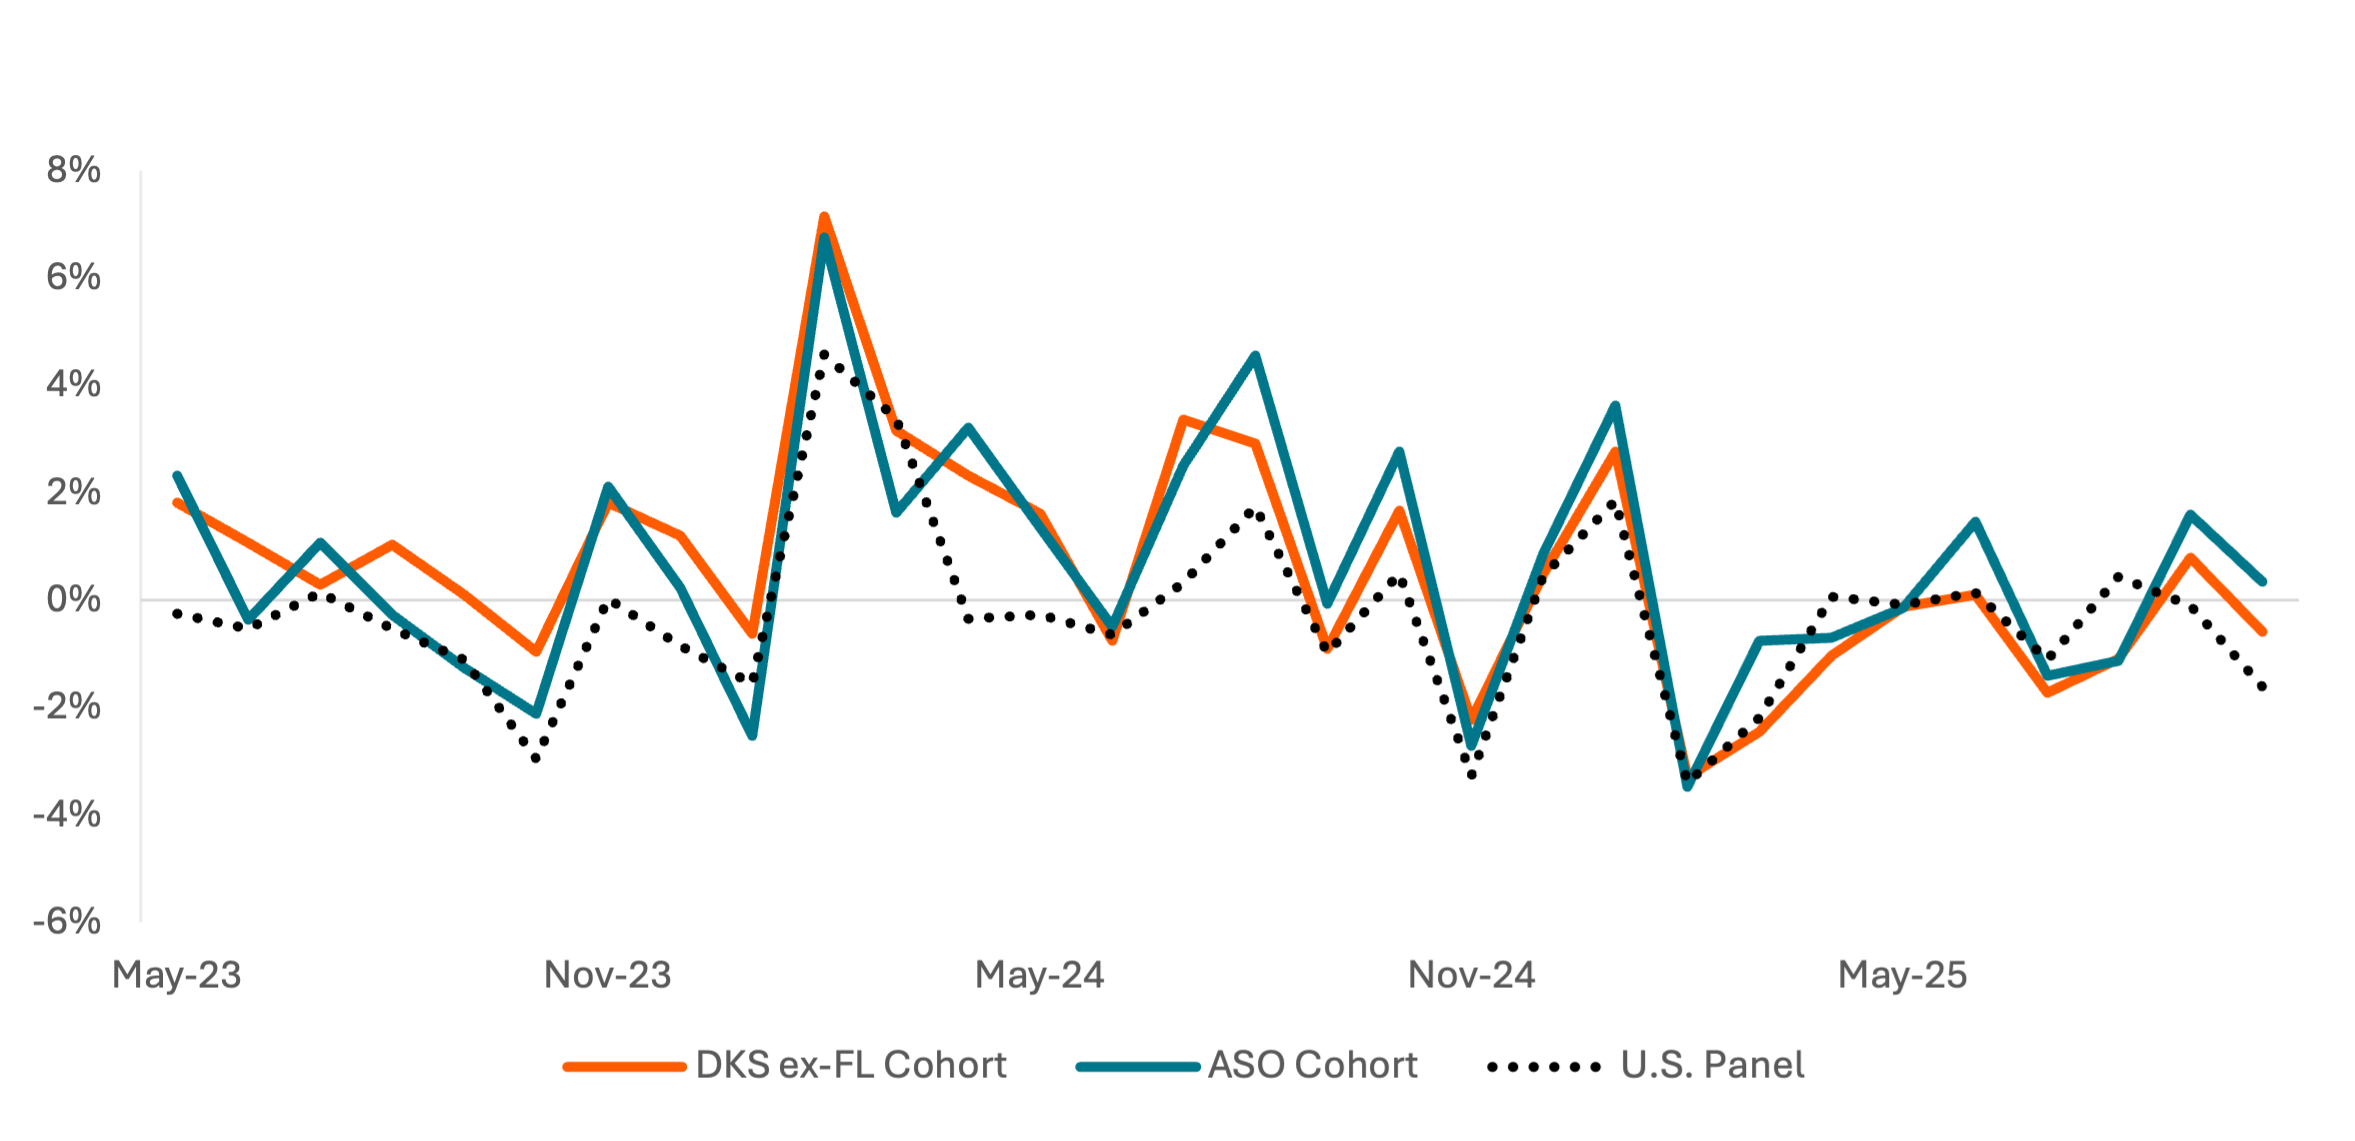
Cohorted card spend data suggests the sporting goods consumer is weaker in 2025 than in 2023 or 2024, when total card spend growth for customers of Dick’s or Academy Sports grew faster than the U.S. average. Despite outperforming Academy Sports + Outdoors comp sales in recent earnings results, the customer base of ASO appears consistently stronger in 2H24 and 2025TD, indicating Dick’s is doing a better job of capturing spend from its customer base but may face increasing challenges in upselling.
Exhibit 22: Youth Sports App Sessions Y/Y Growth
Price: 4.99 Tokens
Exhibit 23: Normalized Sporting Goods Spend at Mass Merchandisers (Indexed to Oct. 2022)
Price: 38.42 Tokens
Exhibit 24: Total Credit Card Spend Growth of DKS (ex-Foot Locker) and ASO Customers
Price: Requires row-level bulk data access, available on request
Appendix
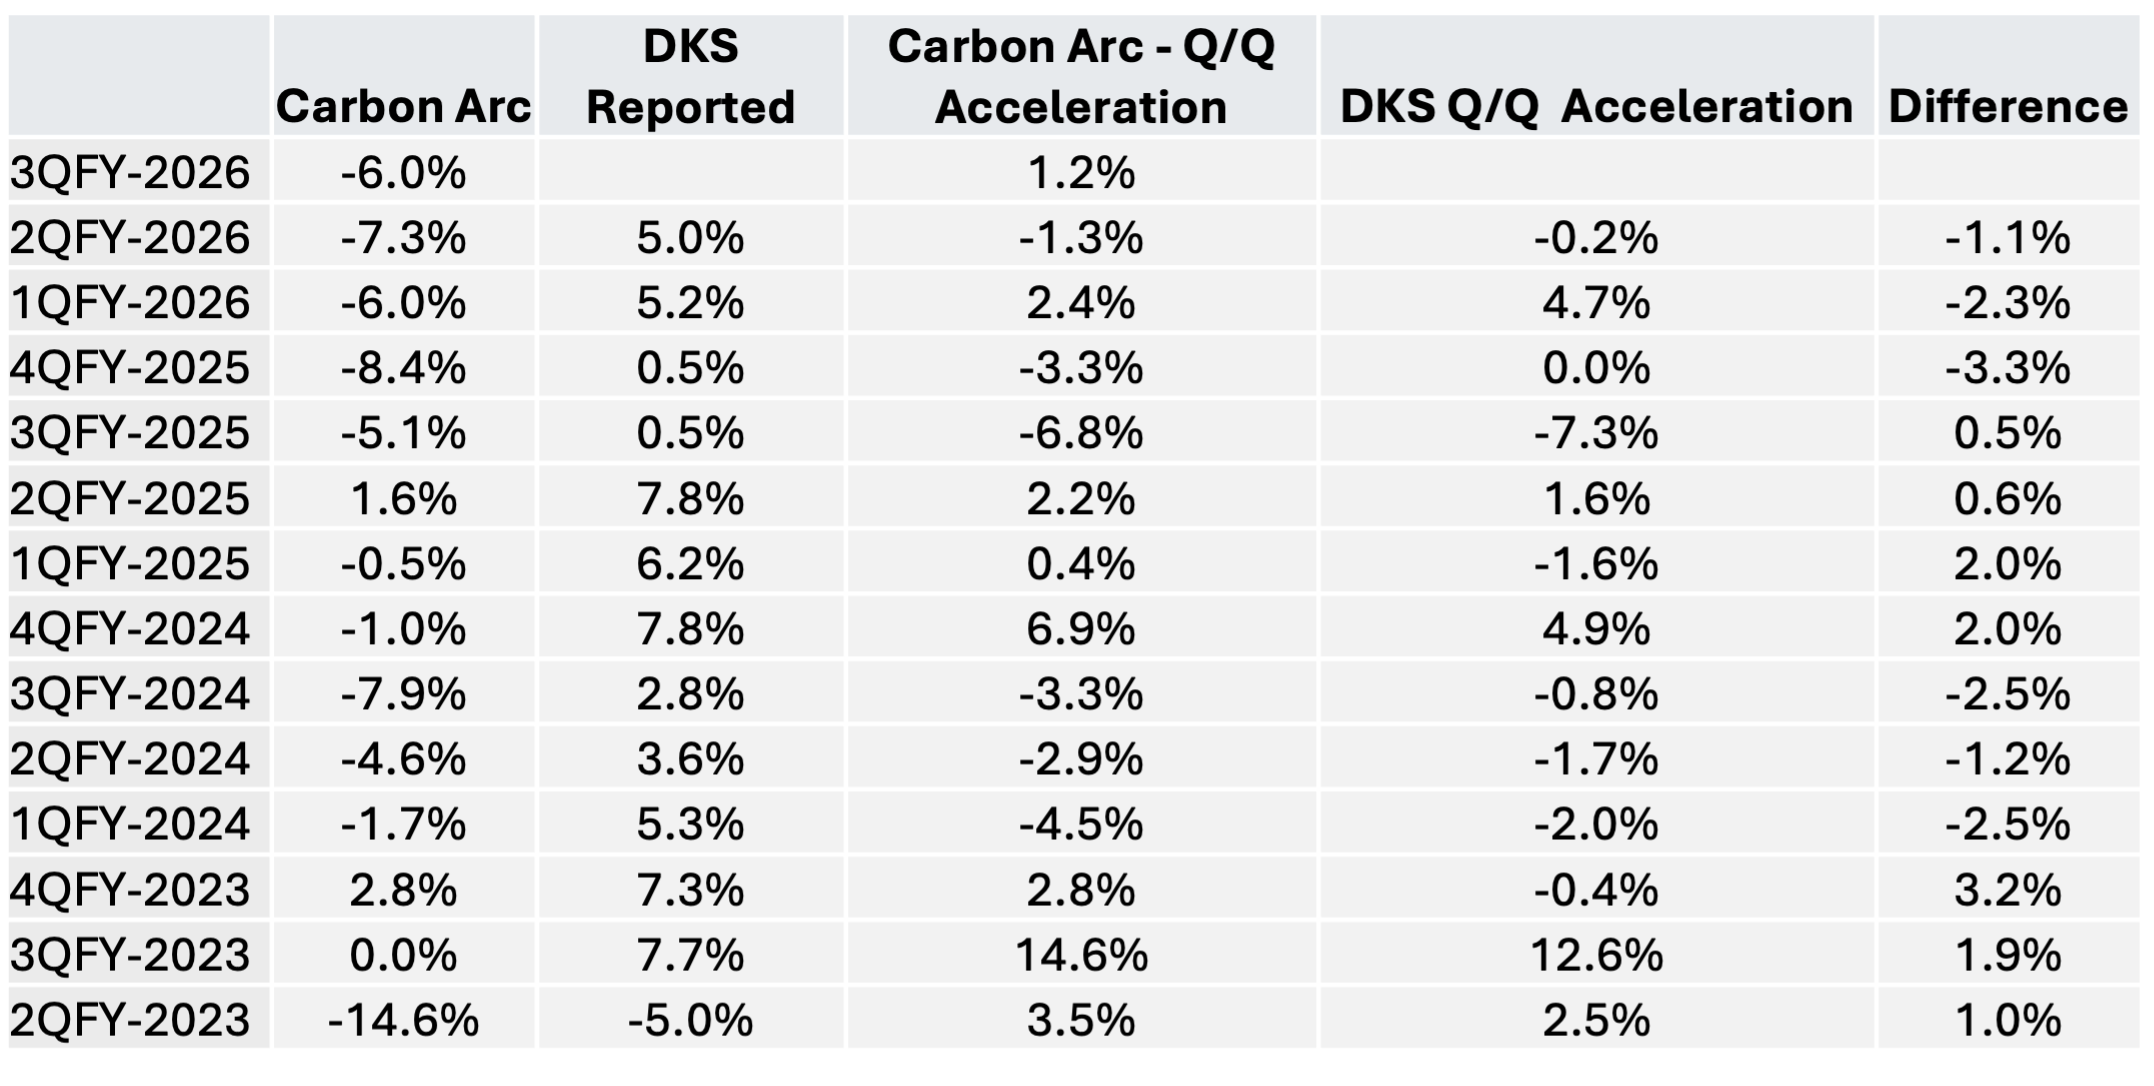
DKS Reported Total Sales vs. Carbon Arc Credit Card – US Complete
References
- Dick’s Sporting Goods, Inc. “Second Quarter 2025 Earnings Call Transcript.” August 28, 2025. https://s27.q4cdn.com/812551136/files/doc_financials/2025/q2/2Q25_DKS_Transcript.pdf
Questions?
Contact us at support@carbonarc.co if you have any questions!
CARARC-20251118-DKS-0001