Company Spotlight
Dave & Buster’s (NASDAQ: PLAY)
Carbon Arc Data Assets: Credit Card – US Complete Panel, Foot Traffic, SMB Workforce, Menu Data, Digital Advertising, Clickstream, Secondary Market Ticket Prices
A Turnaround Process Facing Economic Headwinds
December 2, 2025
Executive Summary
Dave & Buster’s (D&B) represents a compelling opportunity under new leadership that has prioritized restoring the brand's guest-first culture and delivering memorable experiences1. However, the company faces significant headwinds from a challenging macroeconomic environment characterized by weakened consumer discretionary spending and intensifying competition within the experiential dining and leisure sector. Ahead of the company's 3Q results release on December 9, we will analyze key performance indicators including 3Q 2025 credit card spending and transaction data, foot traffic trends, NFL game day performance metrics, advertising spend allocation, competitive dynamics, and regional market opportunities and challenges.
Key Takeaways
-
Carbon Arc’s credit card and foot traffic data assets both point to slightly negative revenue growth year-over-year in Q3 2025, with comps still under pressure and growth increasingly dependent on check size.
-
Foot traffic remains the core problem: mature stores are showing declines, and while new units are impactful, they are not yet large enough to offset weakness in the legacy base or in key coastal regions.
-
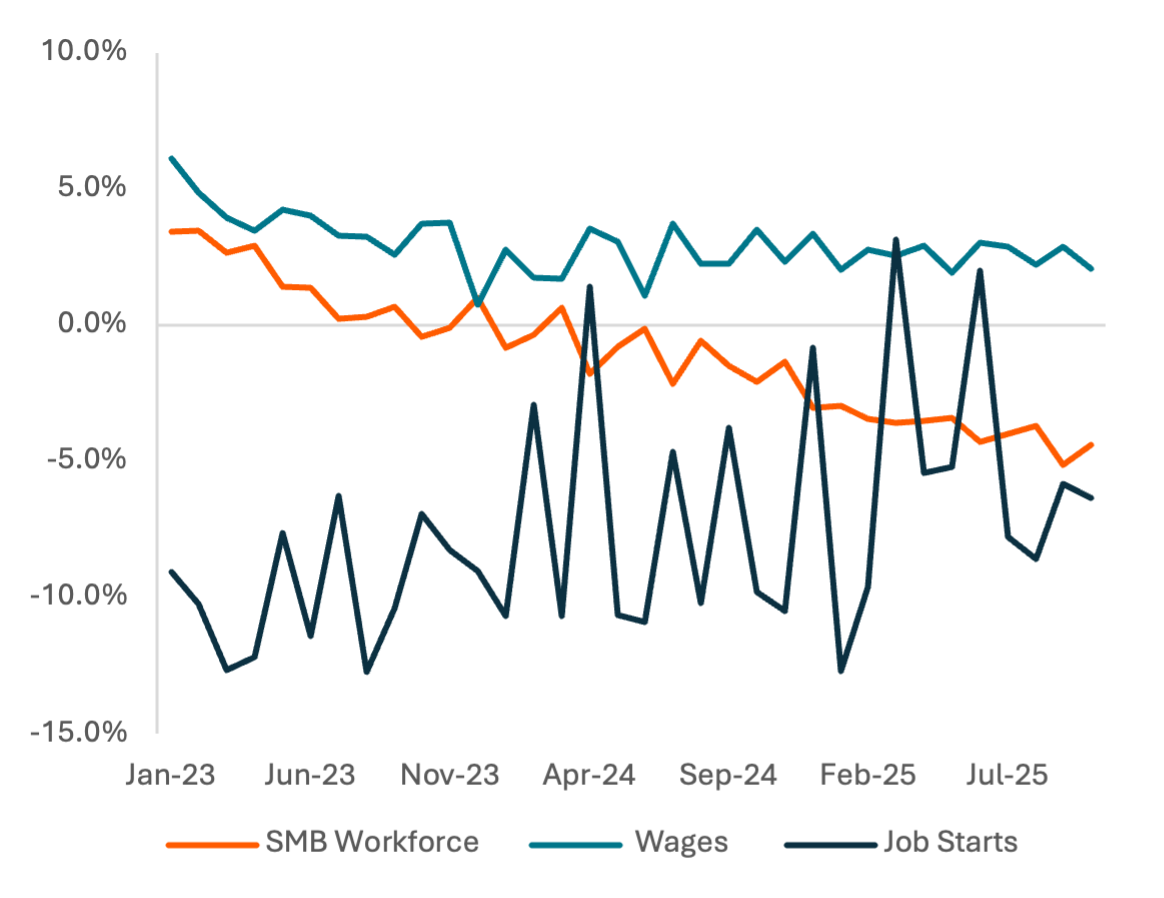
Amid a shrinking SMB workforce, stagnant wage growth, and negative job-start trends, D&B’s turnaround looks relatively more attractive than the broader Casual Dining and Leisure Facilities cohorts.
-
Among experiential competitors, Bowlero and Topgolf also struggle with foot traffic, but D&B has been more effective at driving spend per visit.
-
Regionally, the Pacific is an outsized drag on D&B performance, while New England, the Middle Atlantic, and select launches in the East South Central region illustrate where the brand is gaining traction and where new location selection is paying off.
-
NFL gamedays have historically hurt D&B traffic across most Core Based Statistical Areas (CBSAs, which are more granular than census regions), underscoring why management is leaning into new football watch packages and in-store experiences to re-position gamedays into genuine opportunities.
Top-Line Sales and Momentum
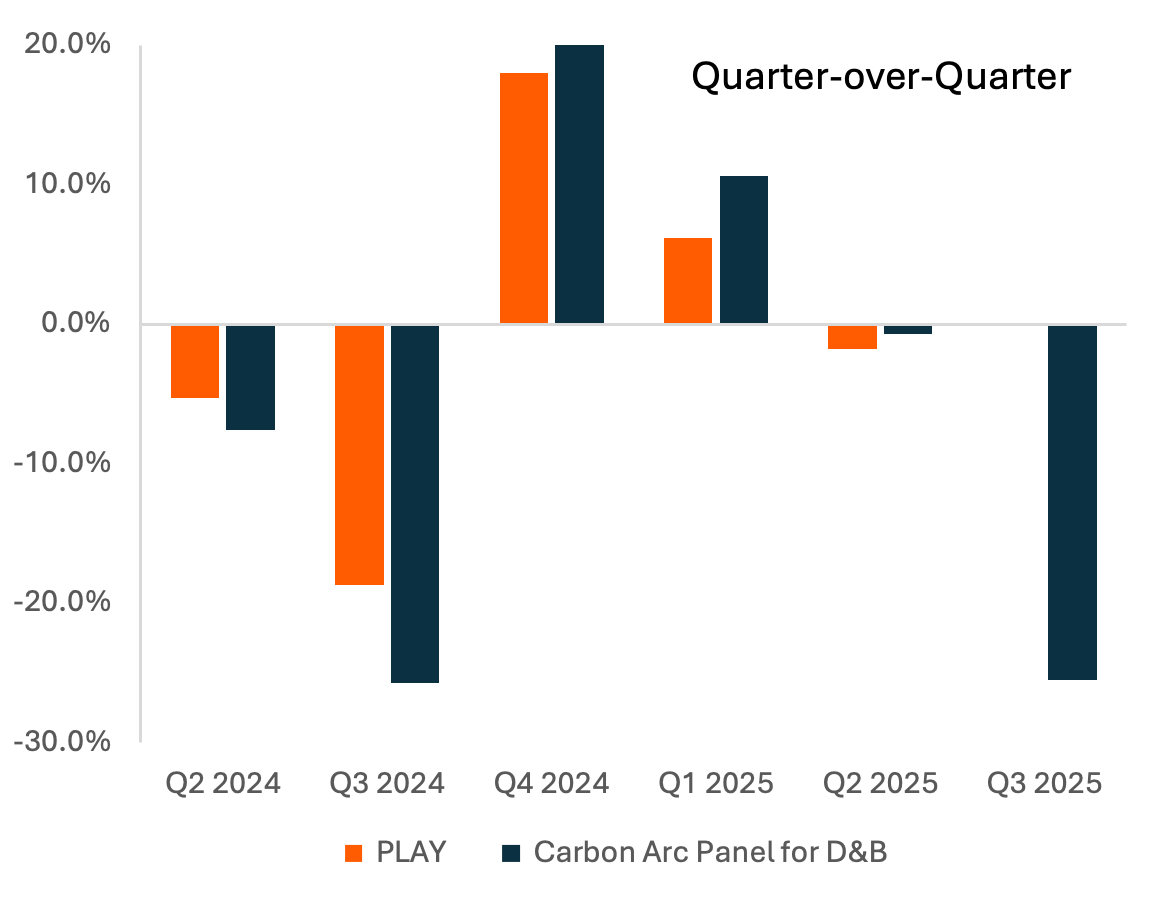
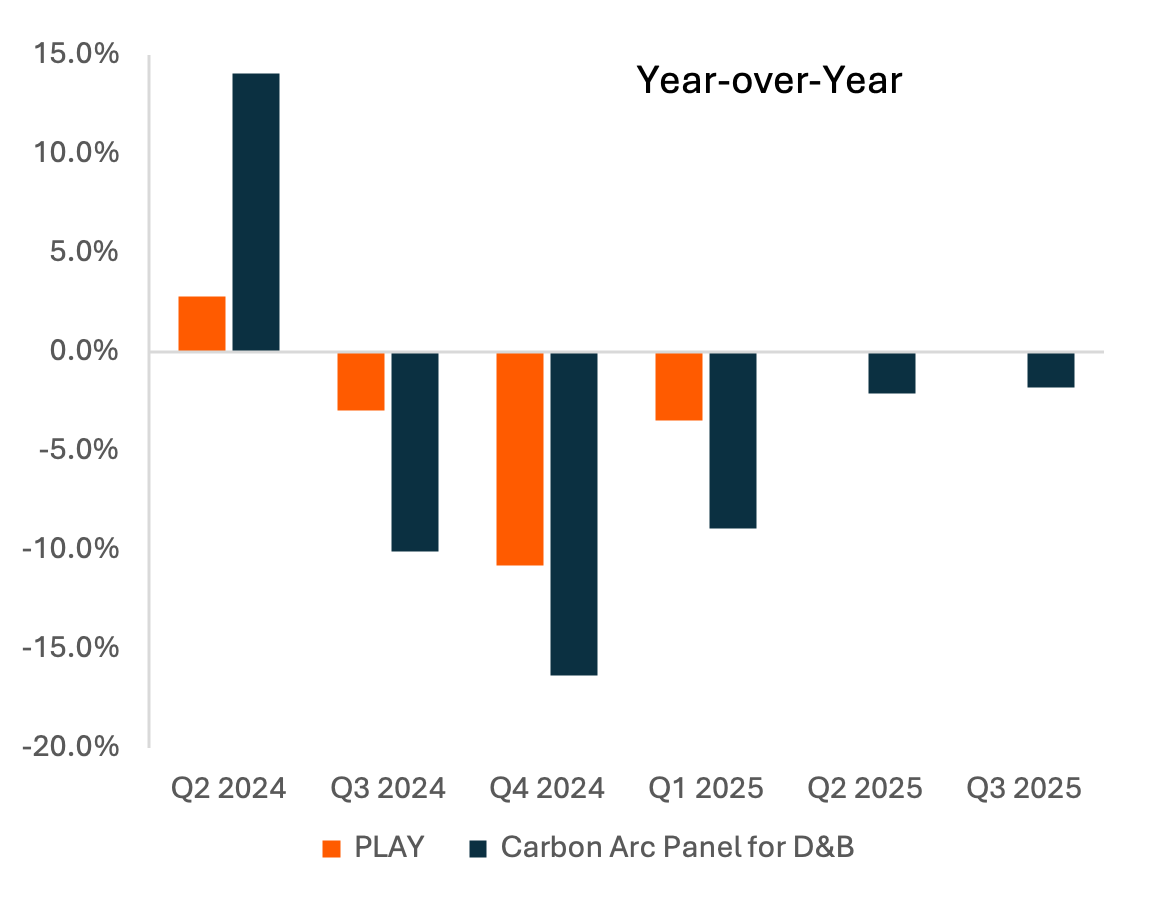
Looking back over recent quarters, Carbon Arc’s constant shopper credit-card panel has moved closely with PLAY’s reported revenues2, capturing year-over-year inflection points and more recent improvement. The panel points to another slightly negative quarter in 3Q FY25 versus last year ($453.0 million), which is consistent with management’s comments that comps remain under pressure even as they work on margins and the broader turnaround plan.
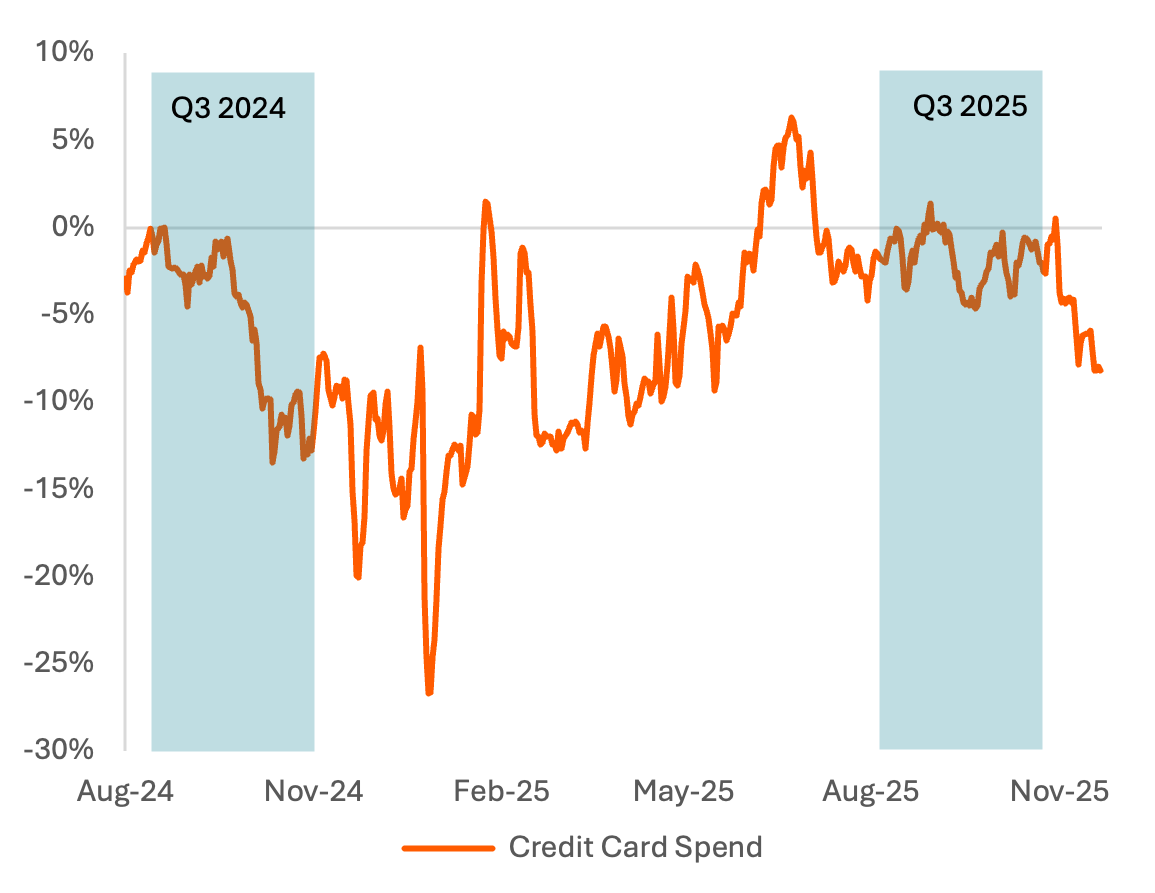
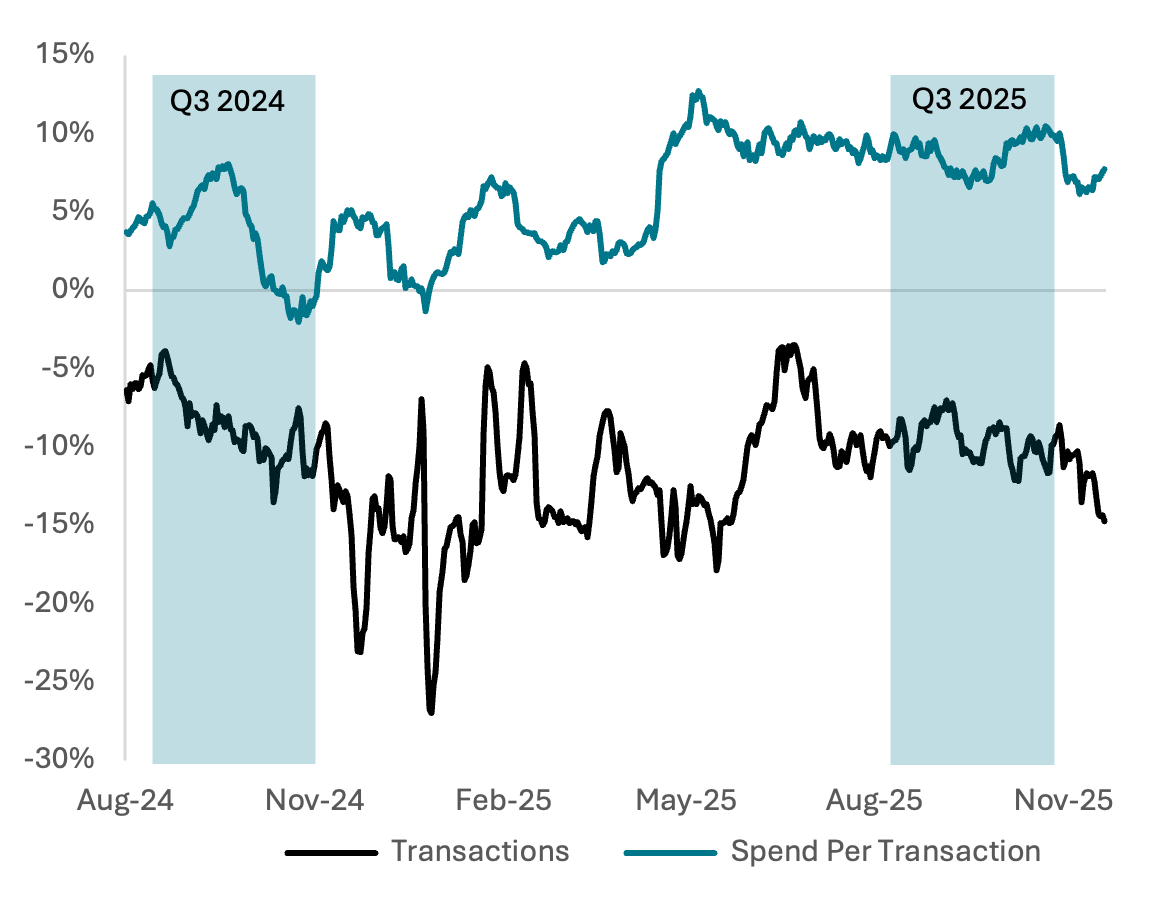
The rolling 28-day views illustrate a portion of the 3Q/4Q issues management is attempting to address. Credit card spend growth briefly improved year-over-year but weakened again as the football season got underway. The value of transactions are holding up better than prior years, but the number of transactions is still down and trending lower. The problem PLAY is facing is not that consumers aren’t willing to spend in Dave & Buster’s, rather it’s getting guests in the door in the first place, especially around this key fall period.
Exhibit 1: PLAY vs. Carbon Arc Credit Card – US Complete constant shopper panel Q/Q (top) and Y/Y (bottom) revenue growth
Price: 8.09 Tokens
Exhibit 2: Dave & Buster’s Y/Y rolling 28-day credit card panel spend
Price: 24.27 Tokens
Exhibit 3: Dave & Buster’s Y/Y rolling 28-day credit card transactions and spend per transaction
Price: 24.27 Tokens
Foot Traffic vs. Revenue and Same Store Sales
Carbon Arc’s foot traffic data asset reaffirms management’s comments on comps, that traffic remains the key challenge. On D&B's 2Q earnings call3, management indicated 3Q comps were consistent with the prior quarter’s guidance (which was again negative), in the minus 2-3% range. Carbon Arc’s foot traffic data indicates those comments were indeed reflective of the remainder of the quarter, ultimately implying a reliance on check size for supporting top-line growth.
The store-mix chart below shows that mature locations continue to post meaningful traffic declines, while new units are seeing strong positive visits, echoing management’s comments that new stores are performing well. Regionally, performance is uneven: a few divisions show improving traffic and spend, but big markets, especially on the coasts, still lag. Carbon Arc’s SMB data asset has shown the Pacific region faces the largest economic challenges and D&B’s stores in the region are highlighting the consequences.
Exhibit 4: Y/Y change in PLAY revenue, Carbon Arc panel credit card spend, and Dave & Buster’s all-store foot traffic
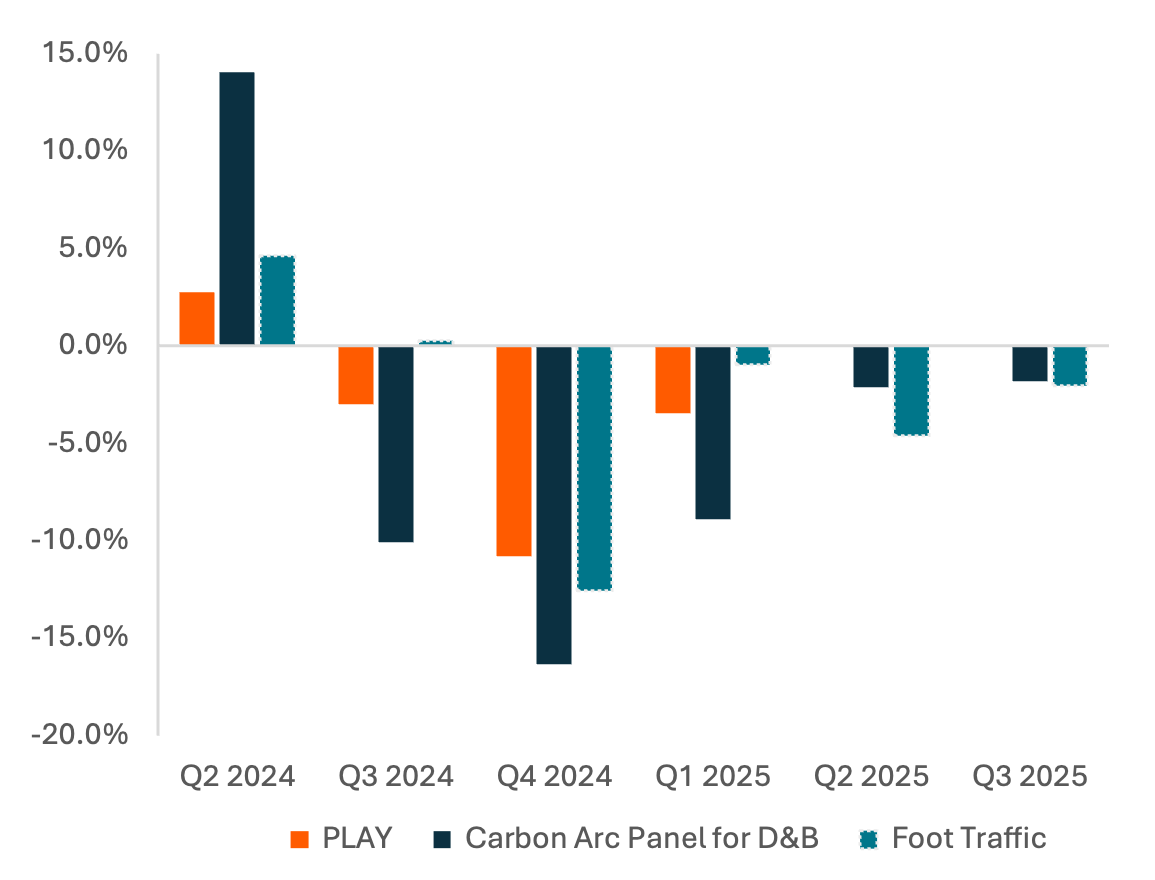
Price: 43.25 Tokens
Exhibit 5: Rolling 28-day Y/Y change in credit card transactions and foot traffic per store
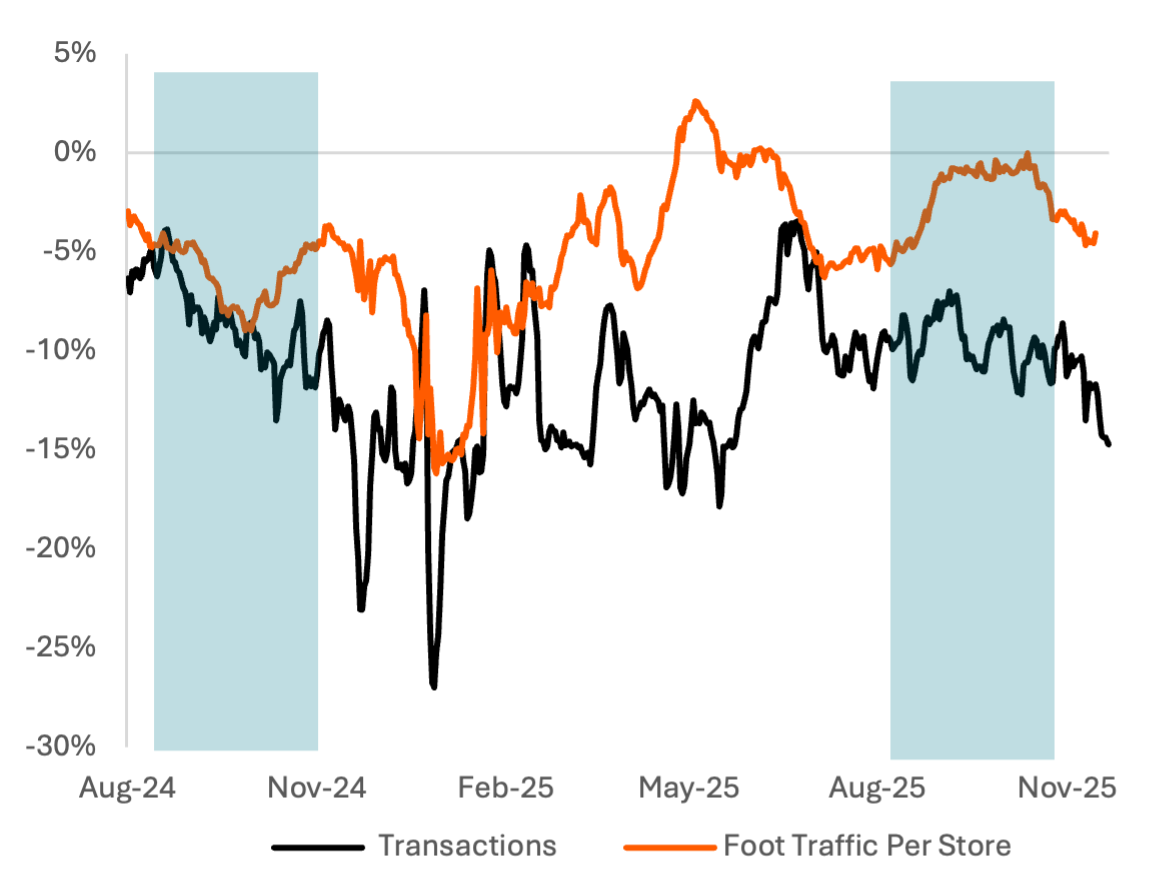
Price: 43.25 Tokens
Exhibit 6: Y/Y change in mature and new store foot traffic per store
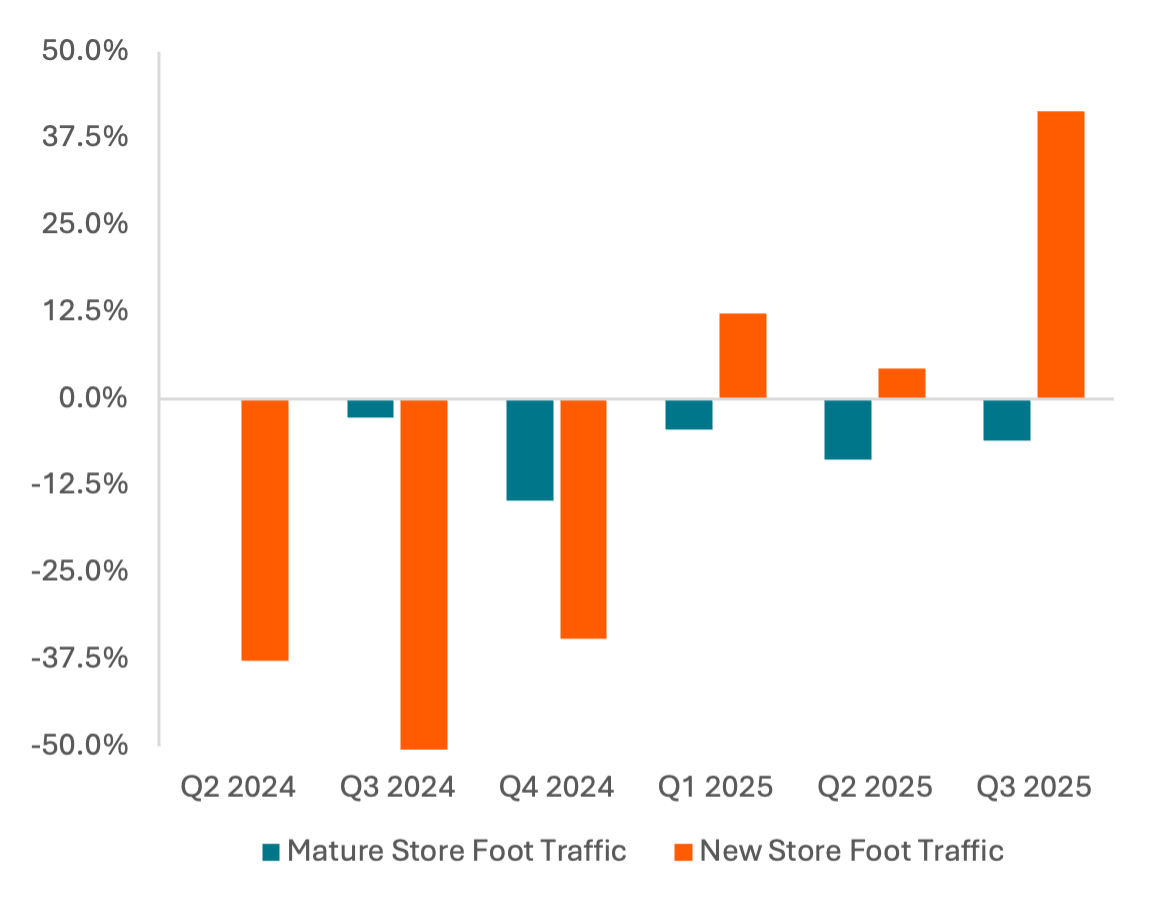
Price: 54.14 Tokens
Exhibit 7: Y/Y change in foot traffic vs. credit card spend by region
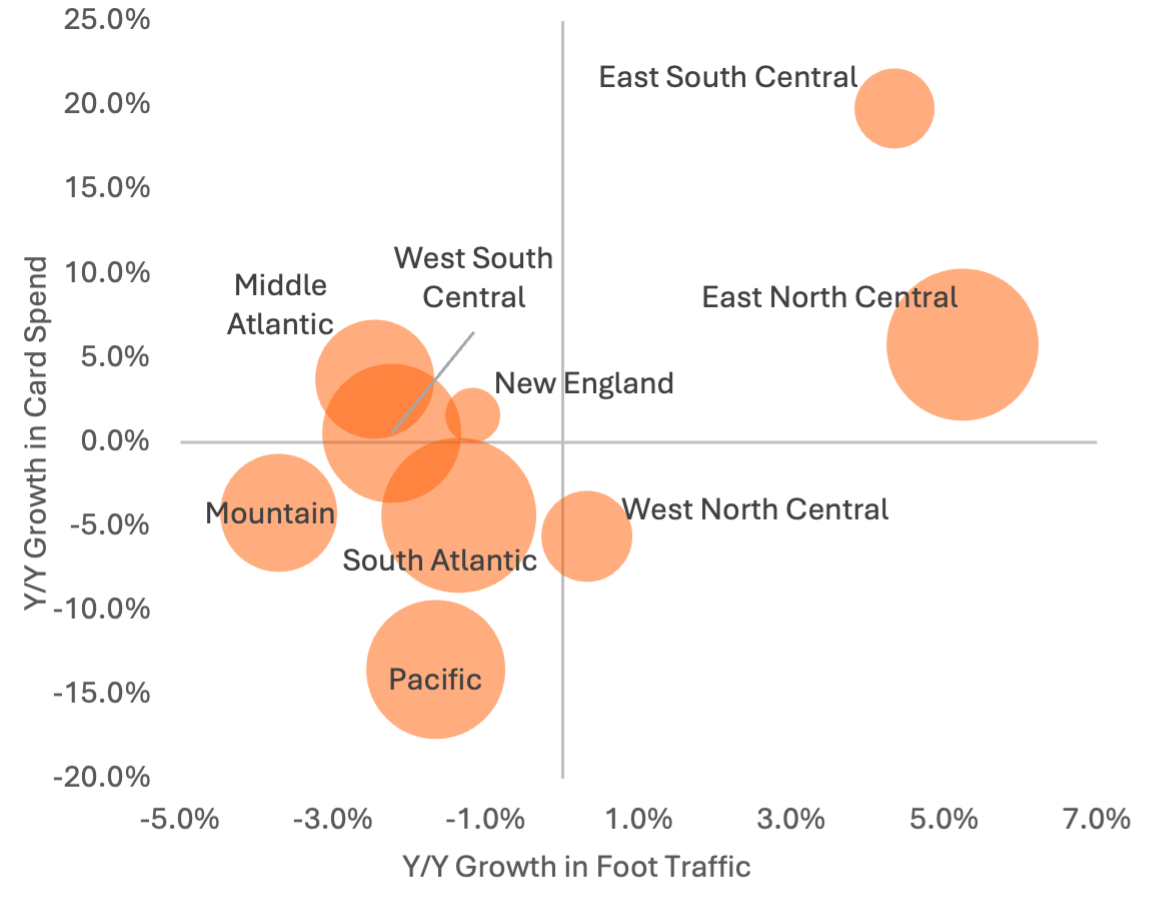
Price: 1018.68 Tokens
Economic & Dining/Experiential Landscape
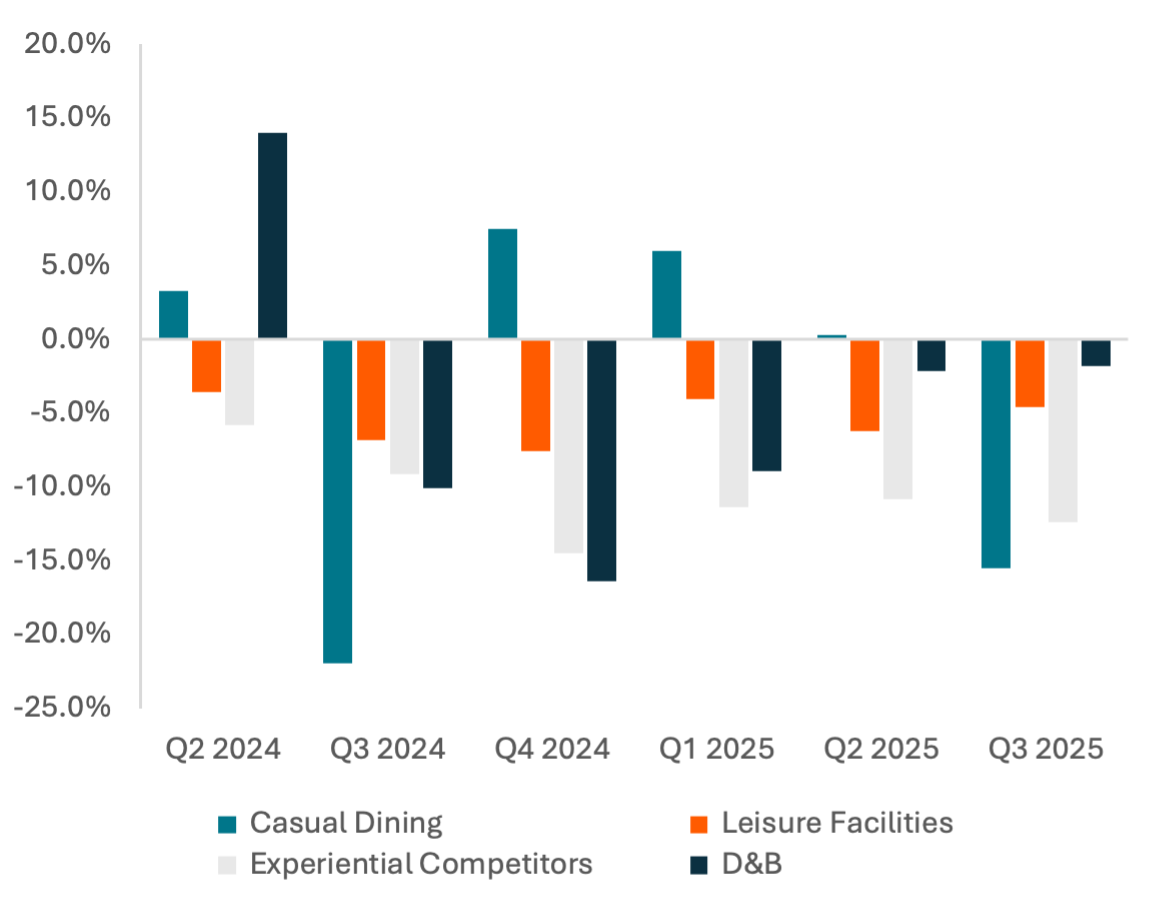
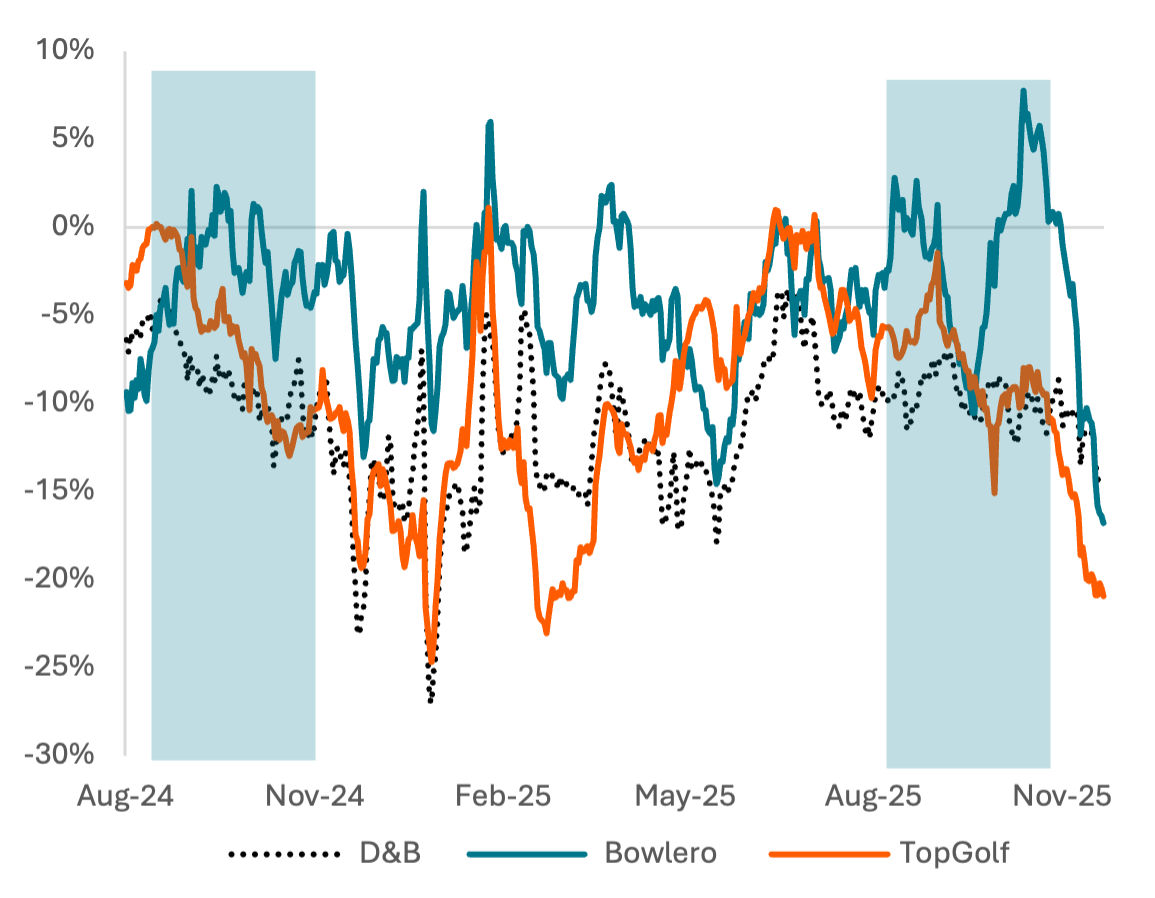
The economic backdrop facing D&B and its peers is challenging. Carbon Arc’s SMB data asset shows consistent Y/Y declines in the workforce since late 2023, stagnant wage growth dipping below the rate of inflation in October, and the Y/Y change in job starts as a percentage of the workforce also consistently negative. For D&B, however, the turnaround story, while stalled Y/Y, appears more attractive in the face of economic headwinds than others. Casual Dining is in an accelerating negative trend, while Leisure Facilities and D&B’s experiential dining/entertainment competitors have been consistently negative Y/Y through 3Q 2025. Both TopGolf and Bowlero have exhibited similar issues getting guests in the door over the last year, but for those who do come, D&B has been much more effective at getting those guests to continue to spend at higher rates. While TopGolf is showing some improvement in Y/Y rates of spend per transaction, it is still well below its peers while transactions are in a nosedive.
Exhibit 8: Y/Y change in workforce and wage growth, and job starts as a % of prior month’s workforce
Price: Requires row-level bulk data access, available on request
Exhibit 9: Y/Y change in credit card spend for D&B fiscal quarters vs. categories and experiential competitors
Price: 27.88 Tokens
Exhibit 10: Y/Y change in rolling 28-day credit card transactions for D&B and experiential competitors
Price: 20.91 Tokens
Exhibit 11: Y/Y change in rolling 28-day spend per card transaction for D&B and experiential competitors

Price: 20.91 Tokens
Regional Trends
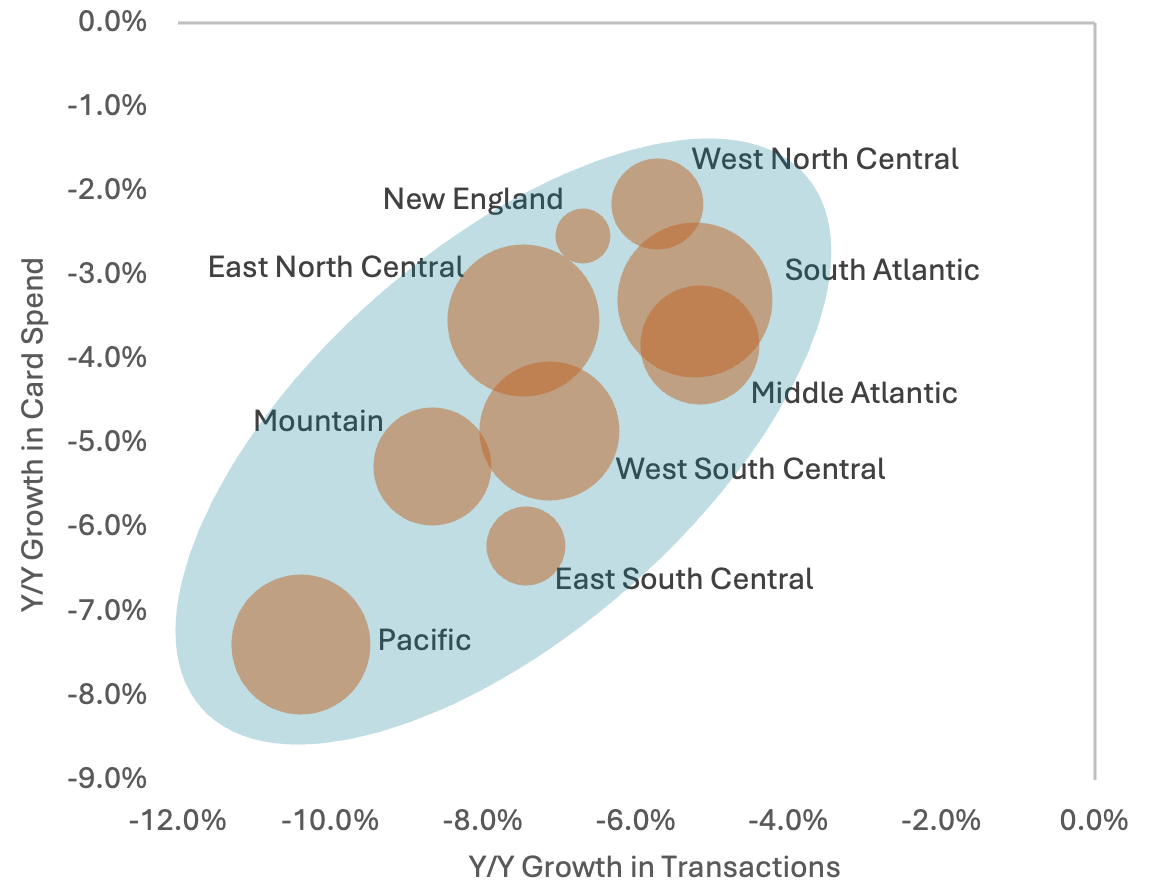
Broadly, Casual Dining spend was under pressure in every region during 3Q 2025, with transactions down Y/Y more than spend, and the not-insignificant Pacific region being the largest drag on both. Against that backdrop, D&B's performance is interesting. In the large East North Central region, D&B was able to maintain transaction levels Y/Y and increase spend, while the Pacific region accounted for a far greater decrease in transactions than the Casual Dining cohort.
While management has stated the focus is on growing same-store sales, the early 2025 launch of a new Mobile, AL location (East South Central) is a solid example of the benefit of finding the right sites, especially with international expansion in its early stages. In terms of regional momentum, New England and, more importantly due to its size, the Middle Atlantic region are appearing most healthy across spend, transactions and ticket size.
Exhibit 12: Q3 2025 Y/Y change in credit card spend and transactions for casual dining (top) and Dave & Buster’s (bottom)
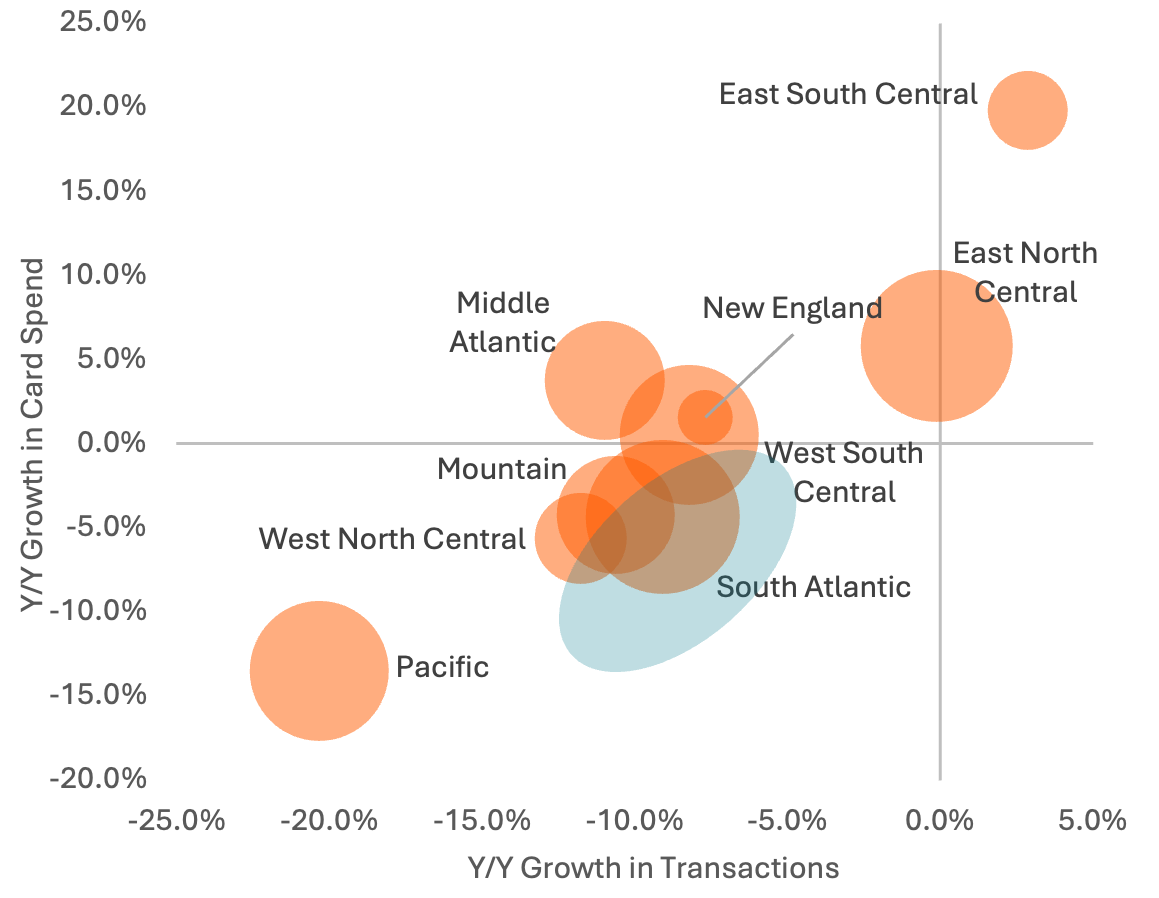
Price: 160.20 Tokens
Exhibit 13: Dave & Buster’s regional spend, transaction and ticket size relative momentum over last five quarters
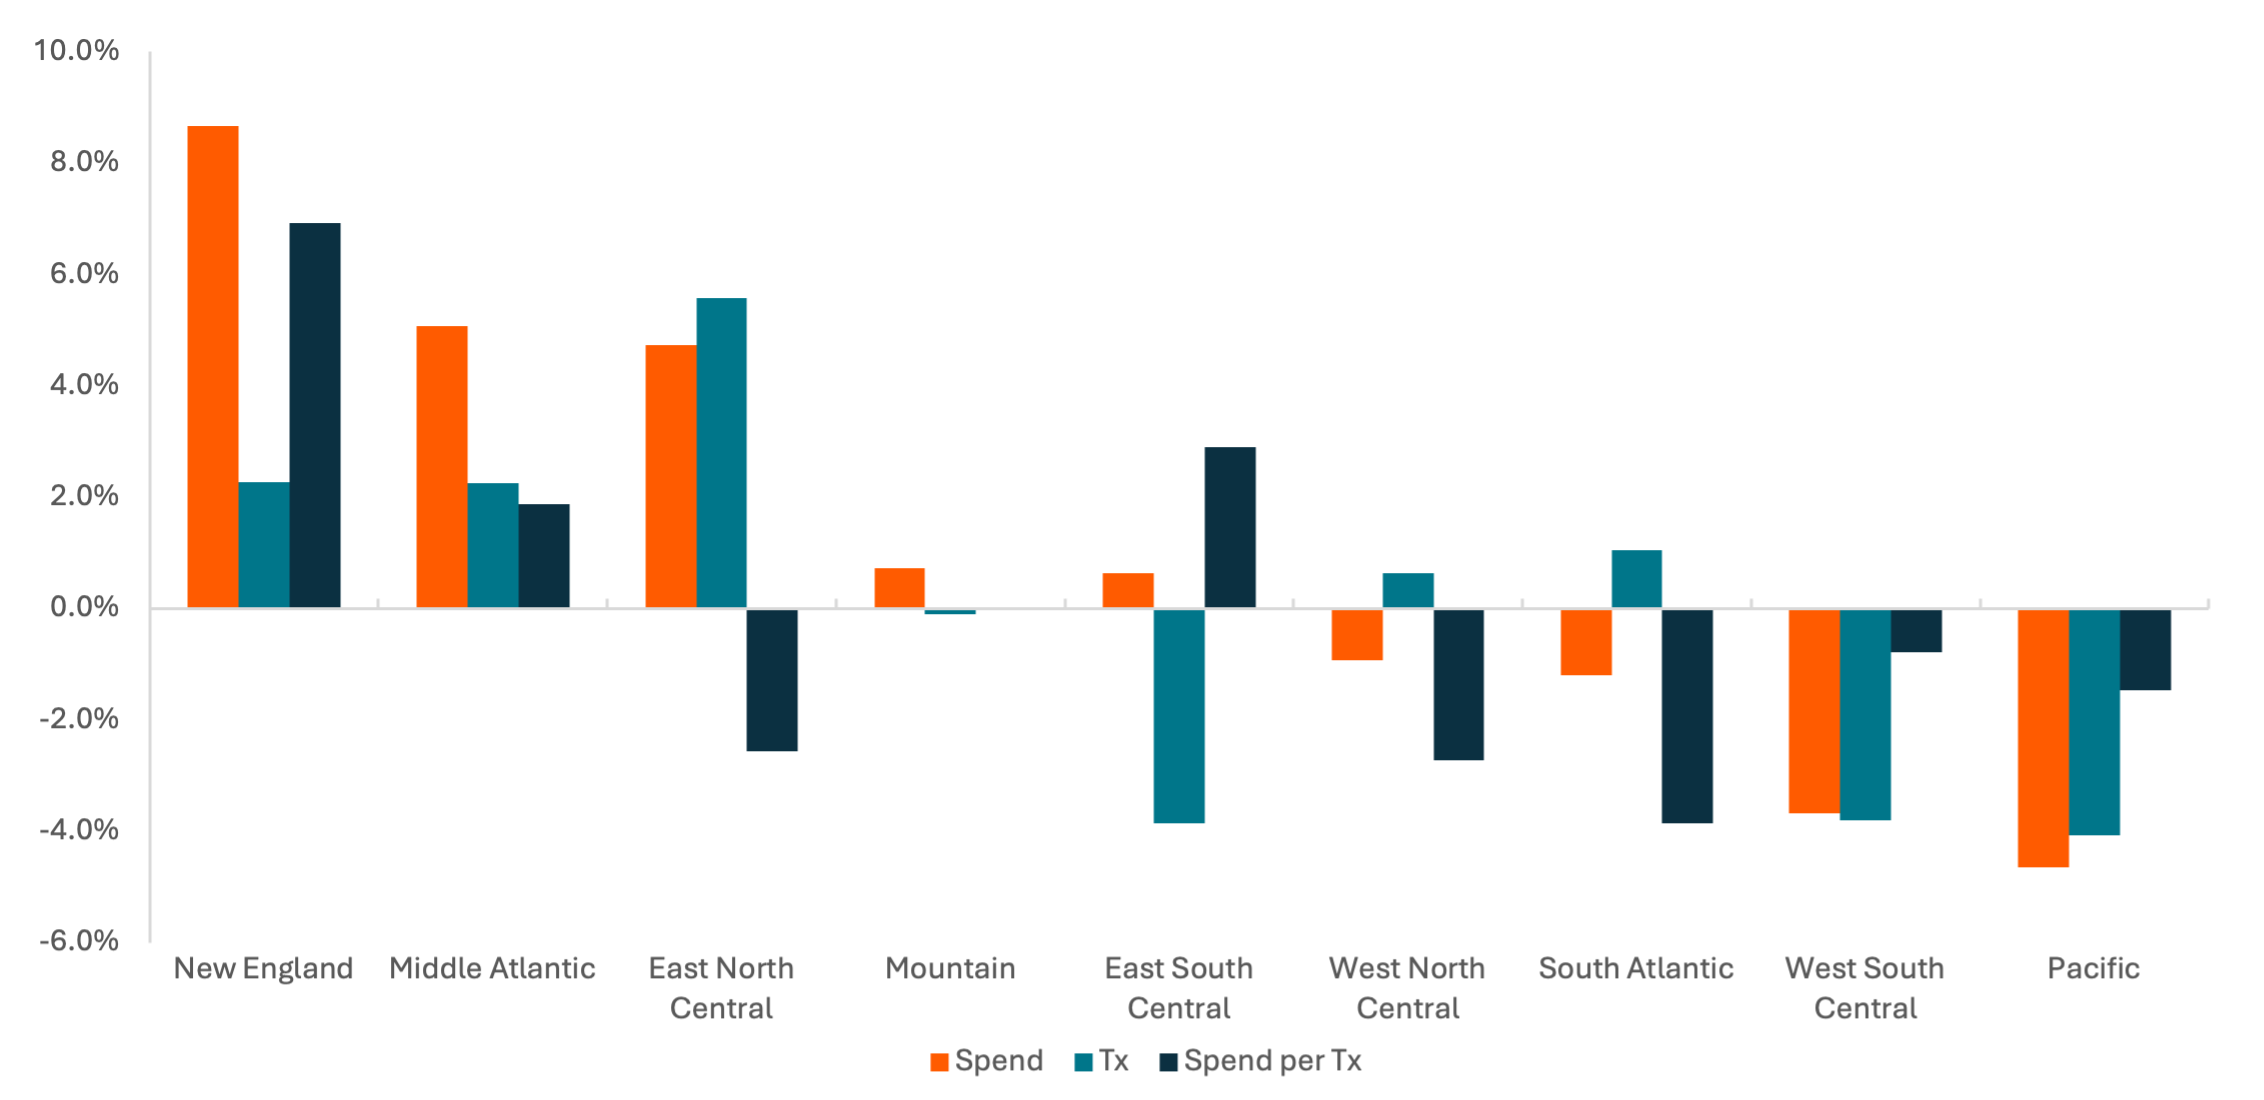
Price: 240.30 Tokens
New CEO, New Goals - Analysis
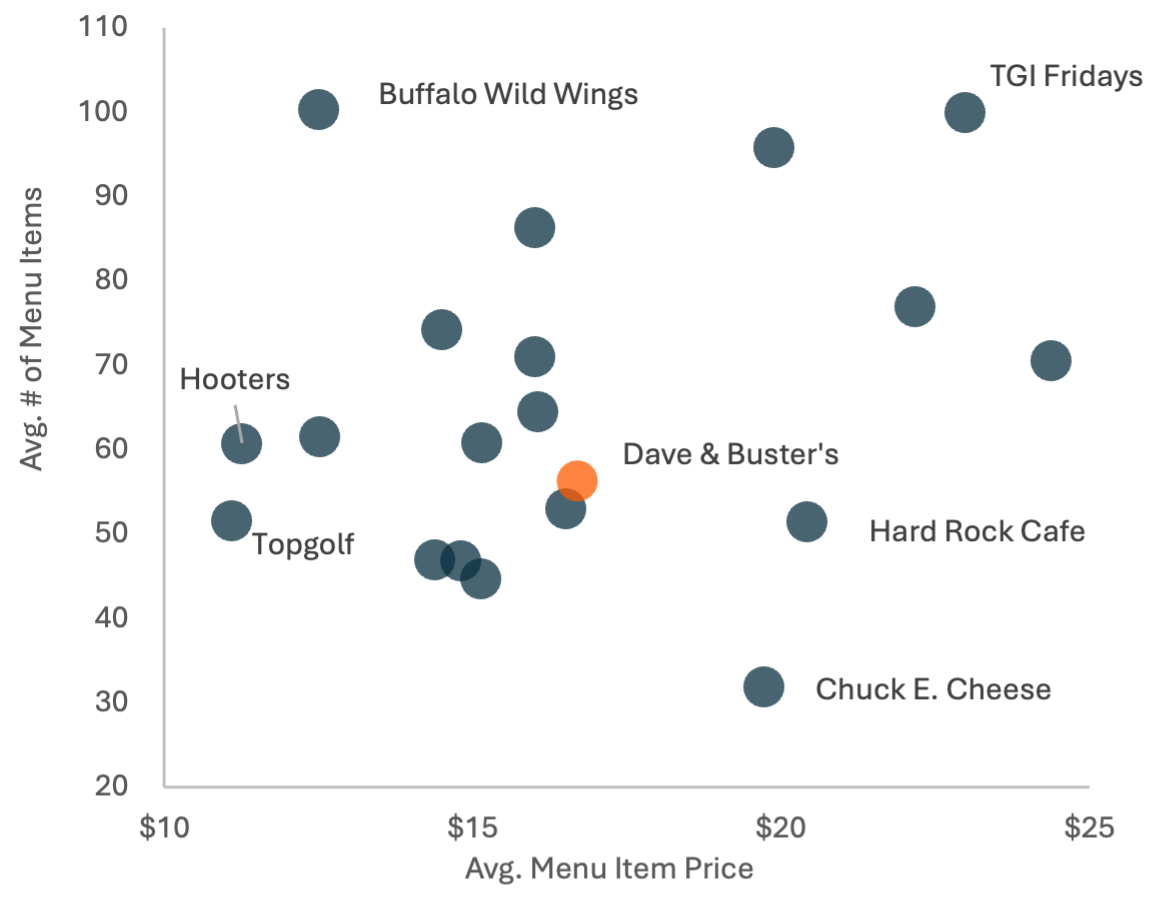
PLAY’s new CEO expressed several strategic objectives during the 2Q earnings call, including going back to basics on menus, launching a new football watch package, and repositioning how ad dollars are spent to effectively communicate the distinctiveness of the brand3. A new menu was rolled out in early November, which will be interesting to track based on where it sat both in terms of complexity and values compared to its bar/arcade cohort (Ex.14).
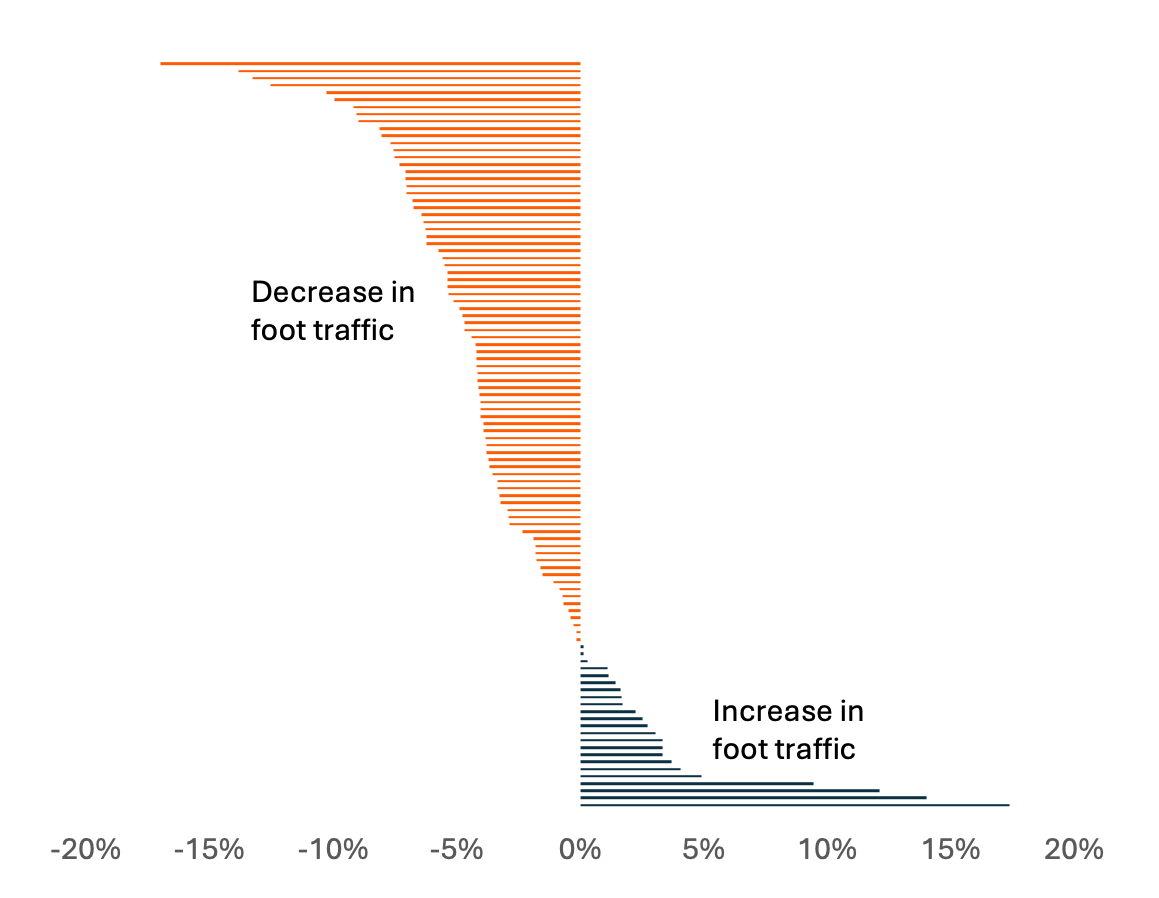
Gamedays have historically had a negative impact on foot traffic across most of D&B CBSA’s (Ex.15), which explains the emphasis on making D&B a gameday destination. Evidence of progress here will be available soon. It is also apparent that management is actively repositioning ad dollars to focus on TV and away from social platforms, which the CEO also believes is the more effective medium for expressing D&B’s distinctiveness.
Exhibit 14: Menu complexity and price comparison for arcade/sports bar cohort
Price: Requires row-level bulk data access, available on request
Exhibit 15: Change in foot traffic on NFL Sundays vs. non-NFL Sundays by CBSA
Price: 33.64 Tokens
Exhibit 16: D&B’s quarterly Y/Y ad spend momentum by platform, Q2+Q3 2025 vs. 2024
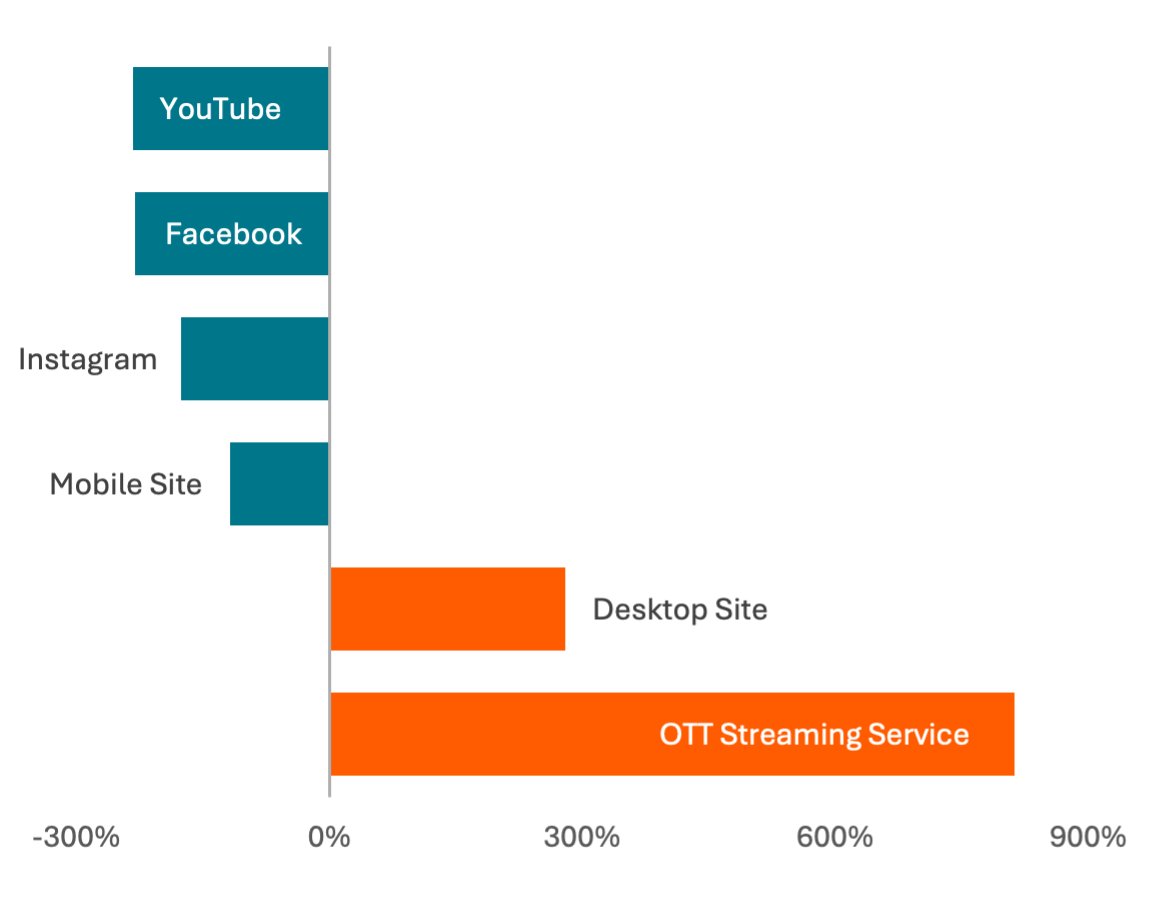
Price: 4.99 Tokens
Exhibit 17: D&B web visits in 2H 2024 vs. 2H 2025, each through November 24
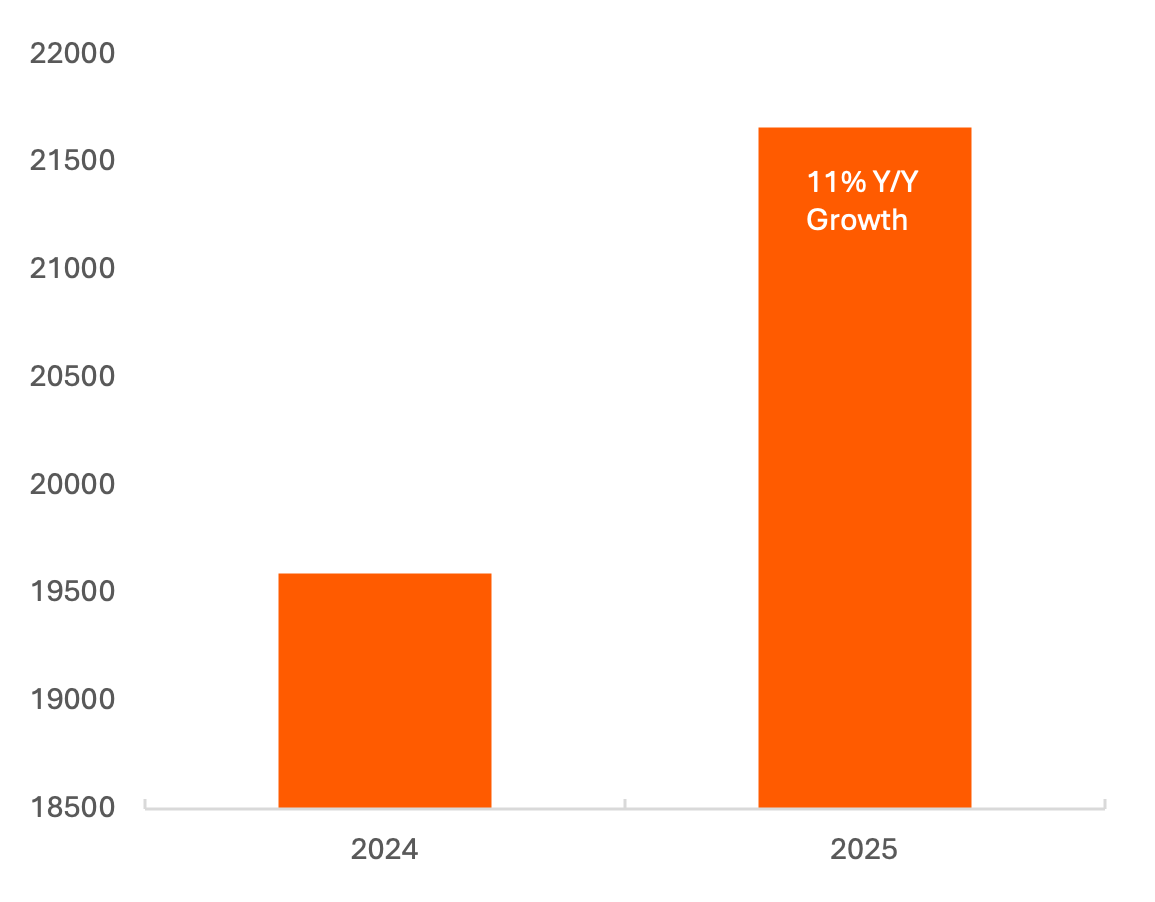
Price: 4.99 Tokens
References
-
Dave & Buster’s 2Q 2025 earnings release notes: https://ir.daveandbusters.com/news-releases/news-release-details/dave-busters-reports-second-quarter-2025-financial-results
-
Dave & Buster’s quarterly earnings results: https://ir.daveandbusters.com/financials/quarterly-results
-
Dave & Buster’s 2Q 2025 earnings conference call: https://ir.daveandbusters.com/events/event-details/dave-busters-q2-2025-earnings-conference-call
Questions?
Contact us at support@carbonarc.co if you have any questions!
CARARC-20251202-PLAY-0001