Weekly Sector Spotlight: US Online Betting
Carbon Arc Datasets: App Intelligence, Clickstream, Concert Box Office, Credit Card - US Detailed Panel, Digital Advertising, Secondary Market Ticket Sales - US
Industry growth, dynamics and the duopoly at risk
September 10, 2025
Executive Summary
The US online sportsbook/betting market exploded following a favorable regulatory ruling in 2018. Two leaders emerged and have maintained a duopoly for several years, enduring slow but steady market share deterioration. The recent partnership between Robinhood and Kalshi is a shot across the regulatory landscape and may impact the duopoly unlike any other prior competitive threat. This report touches on the industry’s growth and brand market shares, demographics and marketing trends, and this new threat to the duopoly.
Key Takeaways
-
FanDuel and DraftKings currently account for ~74% of US online sportsbook/betting card spend, a duopoly which has shrunk slowly, but now faces a potentially significant competitive threat from Robinhood + Kalshi.
-
The sector’s rapid growth has been fueled by mid-to-high income younger-millennial men, a demographic which has grown rapidly and accelerated its spend in the last 24 months.
-
OTT streaming and YouTube are the primary avenues for targeting this demographic, leveraging celebrity endorsements and aggressive promotional campaigns.
-
Robinhood and Kalshi both maintain large proportions of their sites’ web traffic in states where online sportsbooks are either currently not yet legal or severely restricted. Early access to these markets is a significant competitive threat.
-
DraftKings and FanDuel web users do not significantly overlap with Robinhood (max ~3%), but overlap has been rising, and it spikes during very active betting periods.
US Online Betting Growth and Brand Market Shares
The 2018 US supreme court decision that federal regulation of sports betting was deemed unconstitutional, pushing the decisions on the legality to individual states, sparked a boom in the online sports and gaming market.
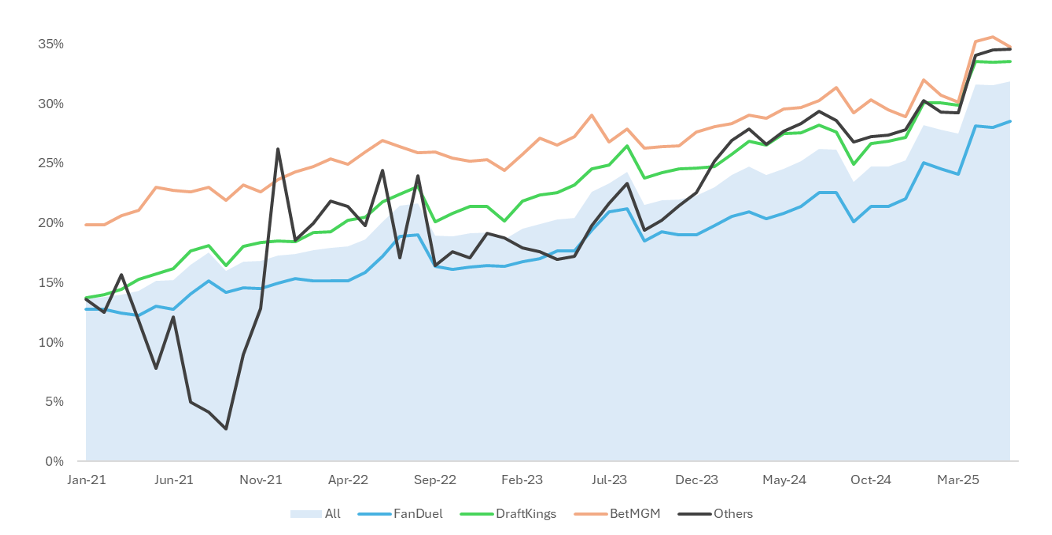
Early and unsustainable triple digit growth rates in US consumer card spend among the current leading online betting brands has dropped through mid-double digits to Q/Q growth rates in the 25-30% range. FanDuel and DraftKings have maintained, albeit declining, duopoly accounting for approximately 74% of US card spend in 2025. The recent announcement by Robinhood that it will enter prediction markets for the NFL & college football will test this declining duopoly.
Exhibit 1: 4-week rolling US card spend, total spend (r) & brand market share (l)
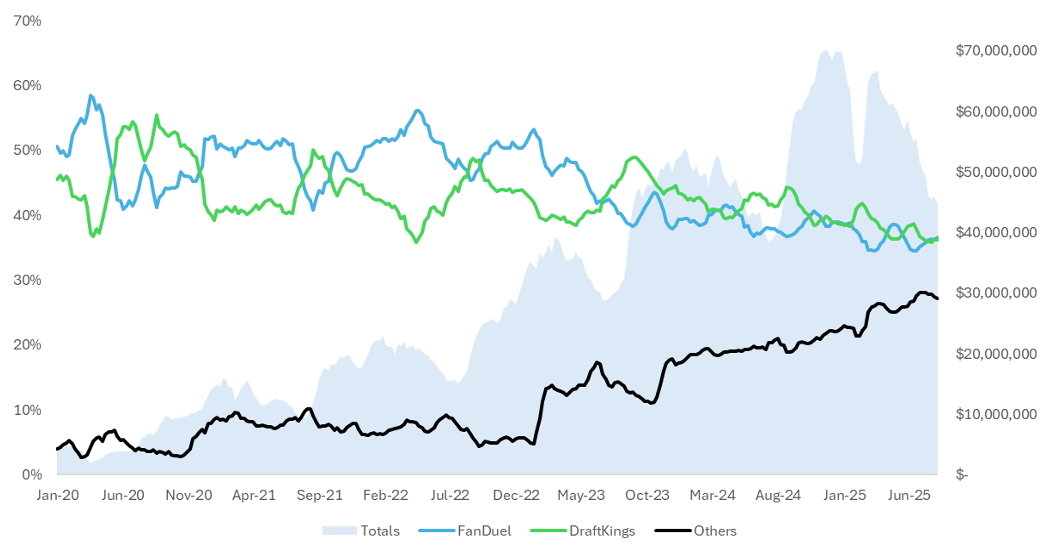
Within the legacy (prediction markets excluded for now) US online betting market, FanDuel and DraftKings’ duopoly has been eaten away at as other entrants have either built upon legacy betting brands, acquired access to new states, or via effective marketing campaigns and/or promotions to attract users.
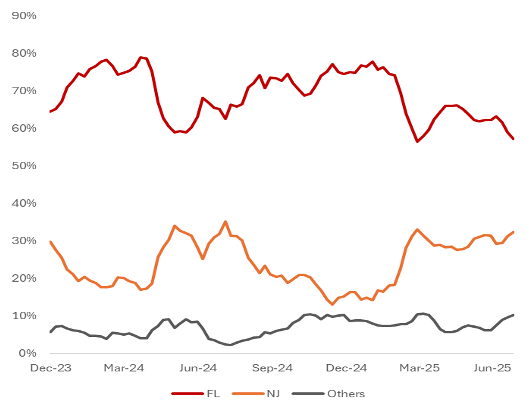
Rapid growth among “others” includes BetMGM, the inclusion of the rebranded ESPN Bet post-Barstool Sportsbook licensing, but also growth from Fanatics with its PointsBet acquisition and Hard Rock Bet, driven in part by continuing access to more states, partnerships to expand gaming offerings and aggressive marketing campaigns. An example of Hard Rock Bet card spend by states gives insights into its core demographic base (FL) and expansion. “Others” are primarily Ohio and Illinois.
Exhibit 2: 4-week rolling US card spend share by state, Hard Rock Bet
Demographics
Using Carbon Arc’s Card – US Detailed Panel dataset we show the demographics of card users for our online betting cohort*, based on yearly income.
The income segments with growing proportions of card users are those with incomes >$100k, with the most rapid growth among those >$150k, though each segment has continued to grow in aggregate. The desire to engage this demographic is obvious. The average monthly card spend per user is significantly higher and increasing.
By brand, FanDuel has the largest overall count of card users, but the lowest proportion within the >$150k segment, instead maintaining slightly higher proportions across the $45-$100k range. DraftKings has a larger proportion of high-income earners, generally in-line with newer entrants within “Others,” including Hard Rock Bets and Fanatics.
Exhibit 3: Online betting cohort*, % of monthly card users by income demographic
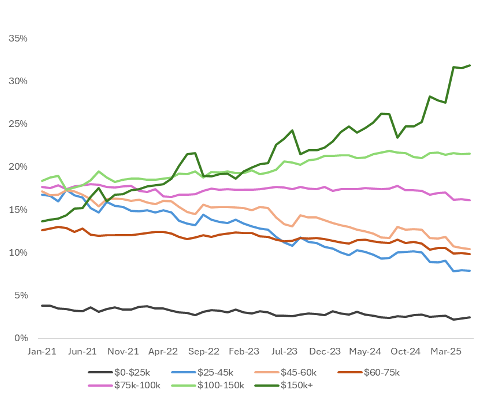
Exhibit 4: Online betting cohort, average monthly card spend per user by income demographic
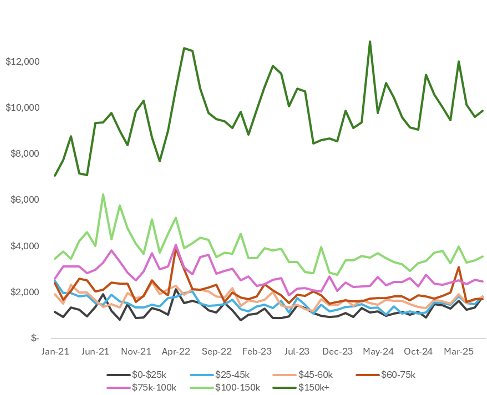
Exhibit 5: Online betting cohort*, monthly card users >$150k, % of total
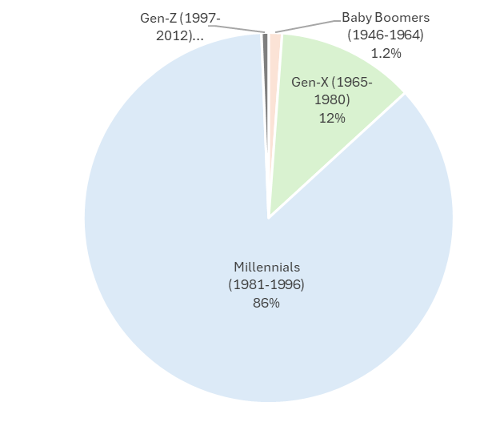
Additional demographics data from Carbon Arc’s Clickstream dataset using the Web Users by Demographic Cohort metric provides additional details of the US online betting primary demographic. They can generally be summed as millennials (likely skewed to younger within the demographic given Gen-X’s proportion vs. Boomers’), male, mid-to higher income earners. This skew to younger within the demographic is relevant to Robinhood’s entry considering the minimum age of 18 for accessing prediction markets vs. 21 for sports betting.
In terms of ethnicity, external resources indicate the majority are white, though higher proportions of non-white, male populations tend to engage in online betting1.
Exhibit 6: US web users by gender, % male, 1YR through Q2 2025
Exhibit 7: US online betting cohort, website users, age demographic, % of total
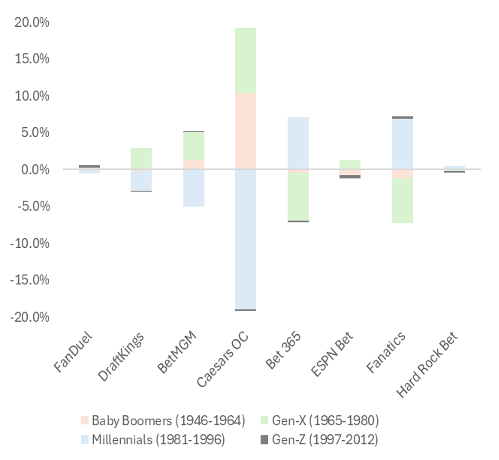
Brand demographics are not uniform. Legacy betting brands like MGM and Caesars have a larger proportion of female users, likely due to their gaming vs. sportsbook heritage. Similarly, Bet MGM and Caesars’ age demographics stray more from the group. Caesars is underrepresented within Millennials, maintaining larger proportions of both older and younger generations. While not nearly as significant, DraftKings has attracted a larger proportion of Gen-X vs. Millennials.
Exhibit 8: Web users, percentage point variation from cohort
Of course, target demographics determine the strategy and focus of marketing and advertising spend. On the following pages we will use various Carbon Arc datasets to interpret industry ad spend trends and brand positioning around campaigns and brand ambassadors.
*Cohort includes, FanDuel, DraftKings, BetMGM, Bet365, Caesars Online Casino, ESPN Bet, Fanatics and Hard Rock Bet **Fanatics Clickstream data is a significantly smaller sample.Advertising Spend & App Downloads
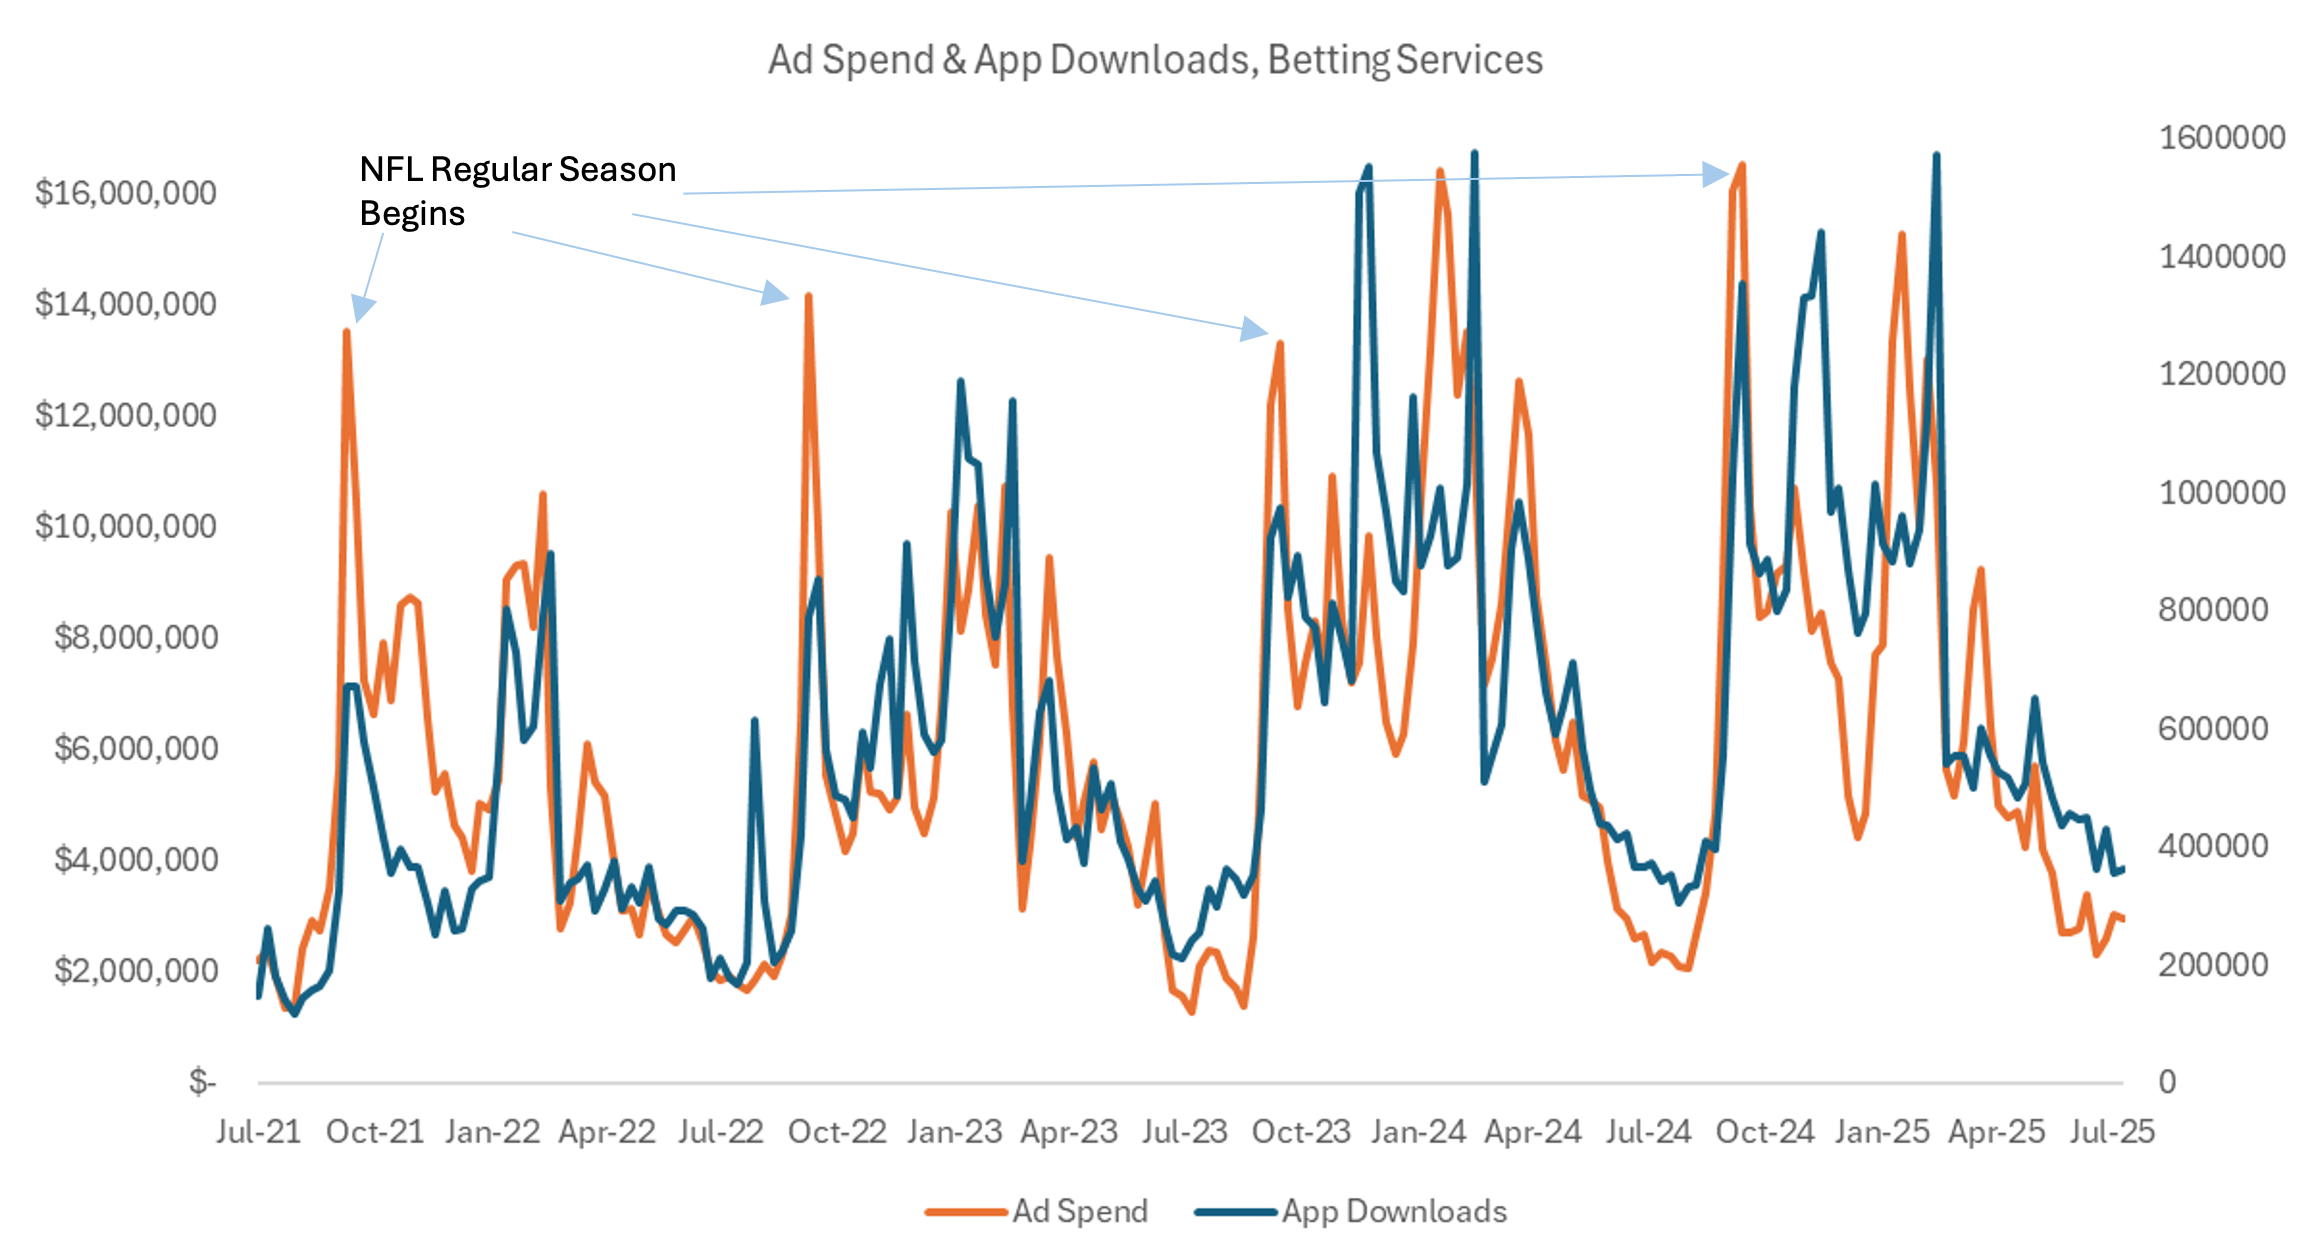
Using Carbon Arc’s Digital Advertising dataset’s Ad Spend data for Betting Services, we illustrate both the shifting importance of digital platforms, and the overall increase and periodicity of ad spend.
OTT streaming services and YouTube have become the most important digital platforms for brands with the two accounting for >60% of the category’s total ad spend. Of the social platforms, Instagram is the current leading choice with Facebook fading and only SnapChat among the others to warrant individual mention. The chart below includes Carbon Arc’s Mobile App dataset along with Ad Spend to illustrate the clear relationship between the two.
Ad spend has historically faded during summer months and spiked at the start of NFL seasons, but there are several other app download and ad spend moments which can be tied to brand campaigns and their relative success at acquiring either new customers, re-engaging prior customers, or encouraging current customers to increase app usage. We will explore examples on the following pages.
Exhibit 9a: 13-week rolling ad spend, Betting Services, market share by platform
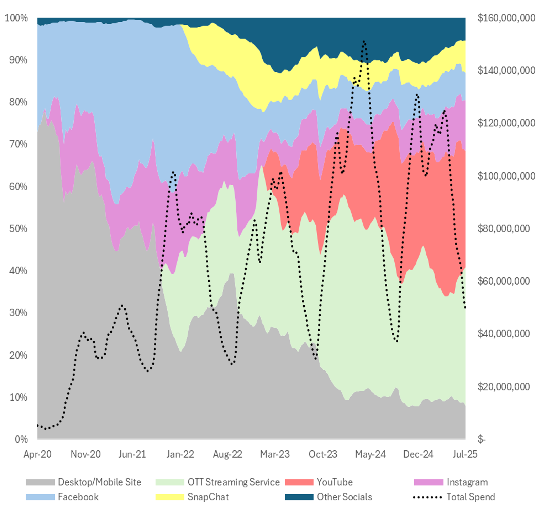
Exhibit 9b: Weekly ad spend and app downloads, Betting Services
Event Analysis - DraftKings vs. FanDuel
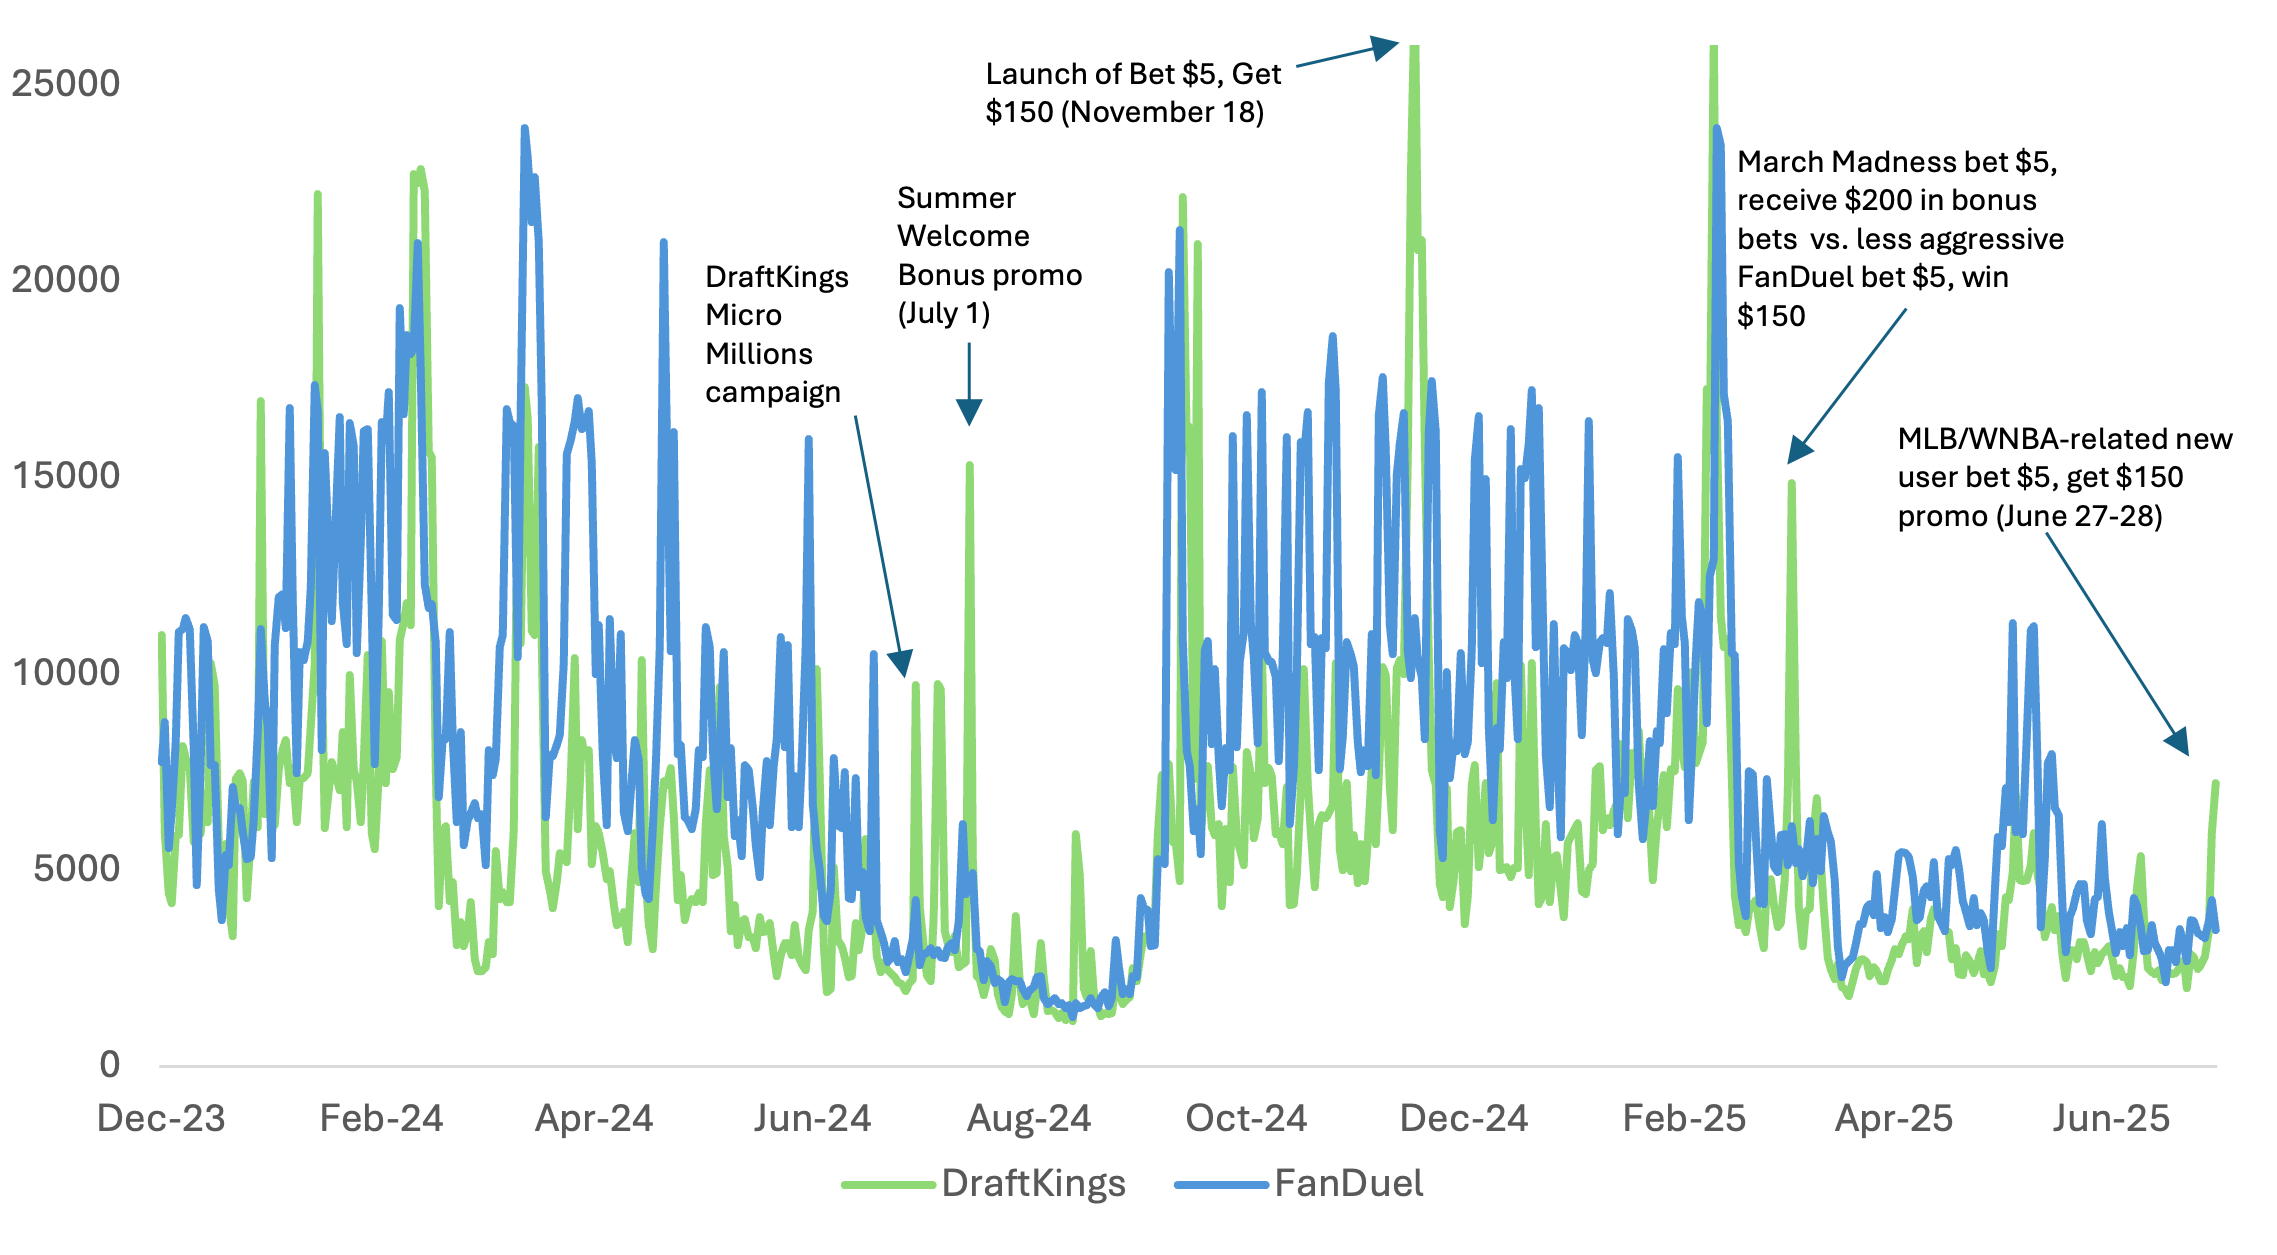
Using Carbon Arc’s App Intelligence dataset, we can measure the impact of specific brand’s marketing campaigns to app downloads. Below we compare daily iOS app download data from market leaders FanDuel and DraftKings.
Though they tend to share periods of very similar download activity, there are notable moments over the last two years where app downloads vary meaningfully, and they can be tied to the effectiveness of very specific events. The first examples, the 2024 Micro Millions and Summer Welcome Bonus campaigns, are notable as they appeared effective at increasing app downloads relative to their primary competitor during the historically slow summer period. Later that summer, DraftKings began to promote its upcoming NFL campaign, which launched in late November 2024, with ads featuring Kevin Hart and LeBron James. There are multiple examples that highlight how aggressive promotions along with effective ads/commercials driven by well chosen spokespeople have proven effective at spurring app downloads.
Exhibit 10: Daily app downloads, iOS, FanDuel & DraftKings
Event Analysis - Hard Rock Bet
Hard Rock Bet (HRB) has been drawing attention for legal, regulatory and marketing events over the last two years. Using daily data from Carbon Arc’s App Intelligence and Clickstream datasets we look at how various events have impacted attention directed to HRB’s platform and bettors’ willingness to download their app.
The largest spike in daily app downloads was actually not around a specific promotional campaign, but on the day of the Copa America final between Colombia and Argentina in Miami. Recall HRB was and still is the only legal sports betting option in Florida. Interestingly, the largest level of website traffic ever for the HRB platforms came in October.
Exhibit 11: Daily web traffic (l), app downloads (r), Hard Rock Bet
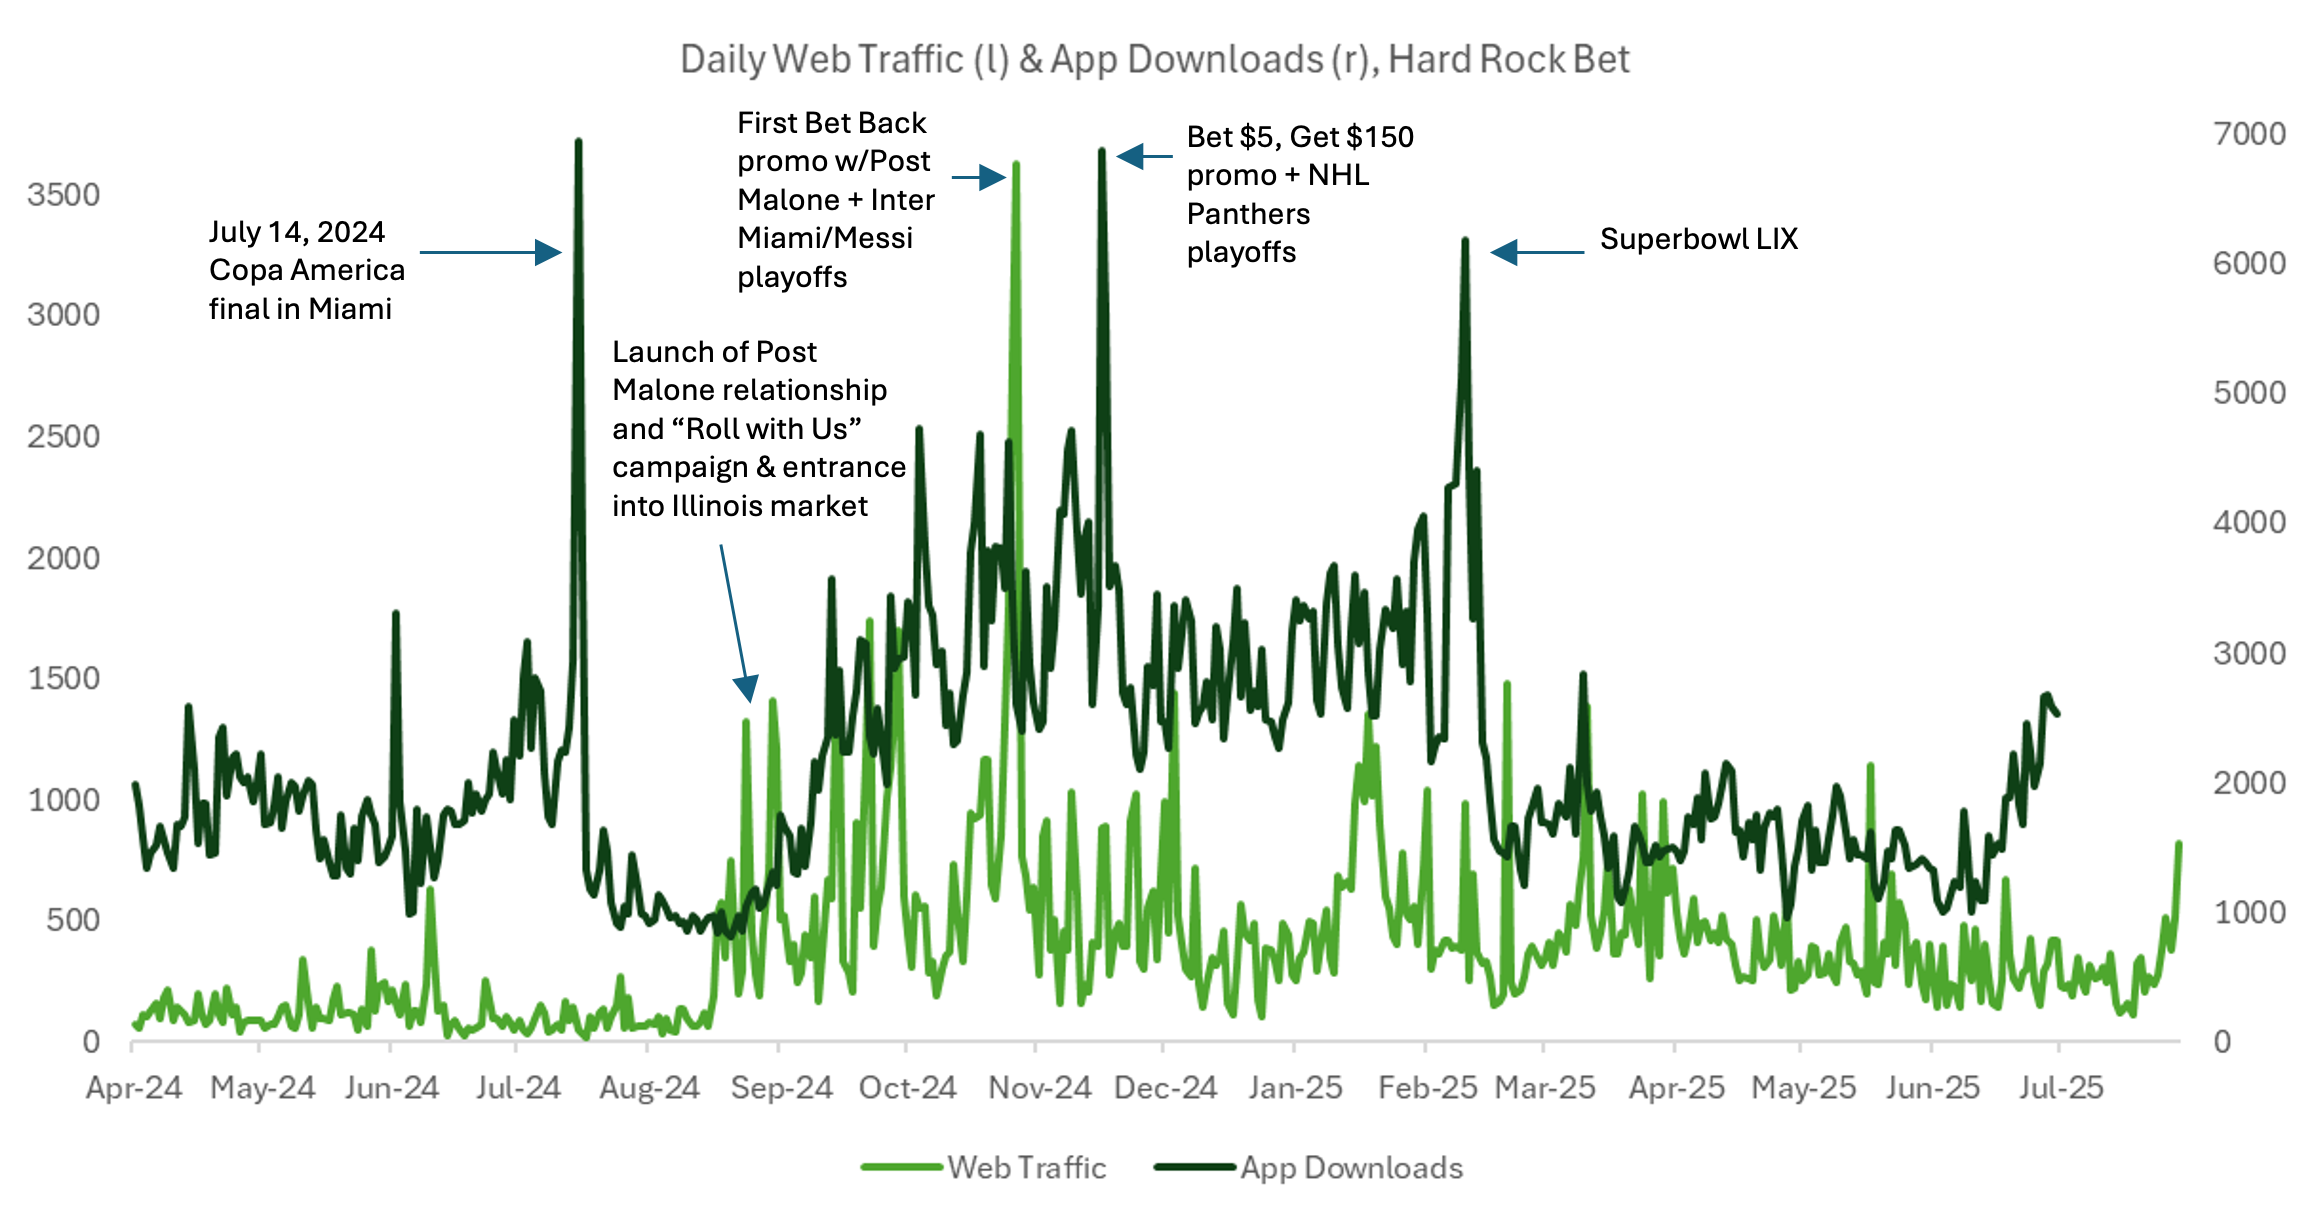
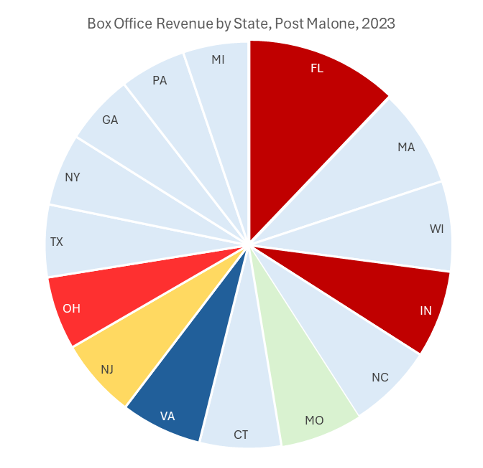
DraftKings began its alignment with Kevin Hart in 2022-2023 and since, establishing effective celebrity relationships has been a priority across the online betting landscape. In mid-August 2024, HRB launched its first major celebrity-endorsed campaign with Post Malone and the “Roll with Us” ads which coincided with HRB’s largest increases in web traffic and subsequent sustained increase in app downloads as the NFL season got underway.
The year prior to this relationship, Carbon Arc’s Box Office dataset by point-of-interest indicates the relationship between Post Malone and Florida audiences was strong. Highlighted slices are states where HRB is currently legal. Data from 2025 indicates the artist also resonates well in states where online sportsbooks are soon to be legal.
Exhibit 12: Box office revenue by state, Post Malone 2023
A Duopoly at Risk
The partnership between Robinhood and Kalshi should be concerning for both DraftKings and FanDuel for multiple reasons, but also for some of the smaller players.
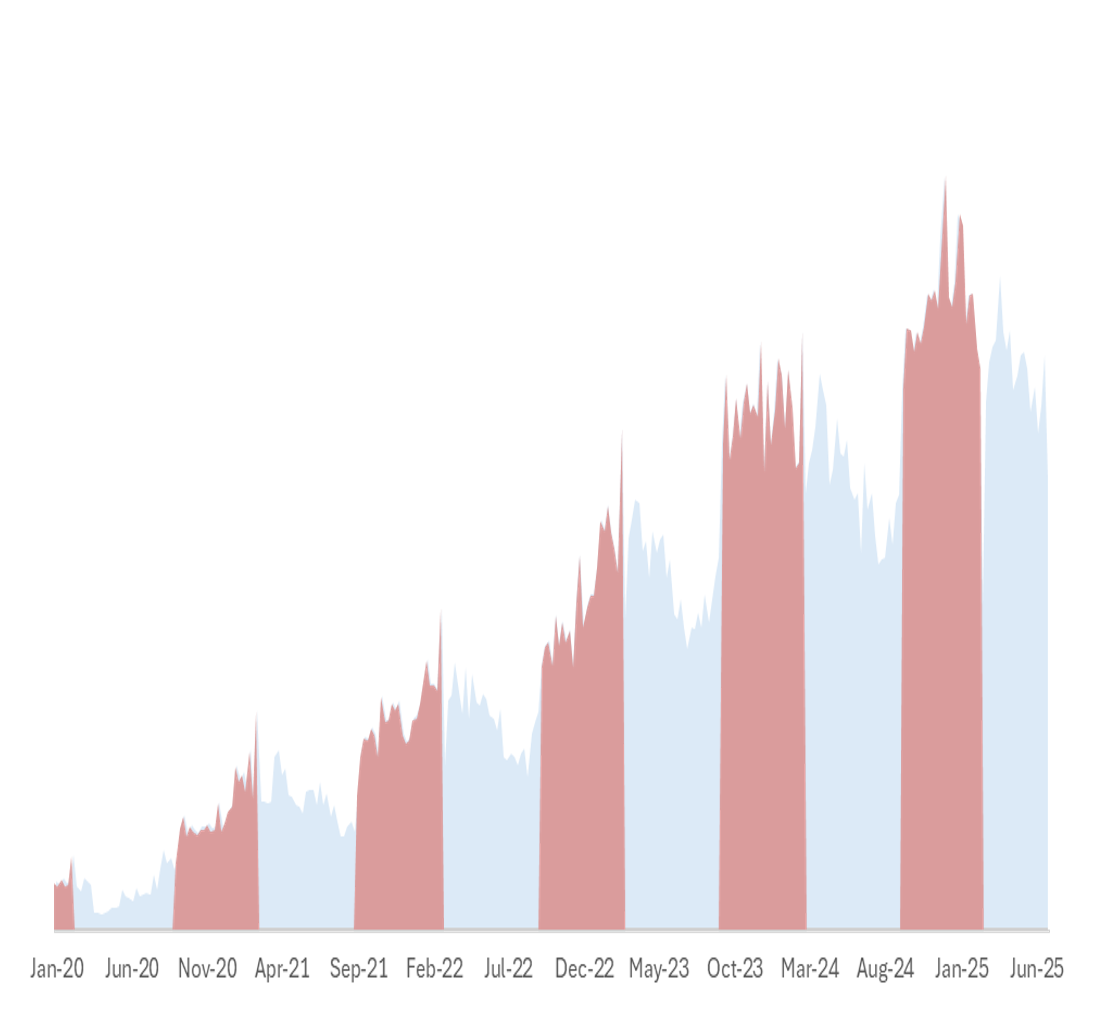
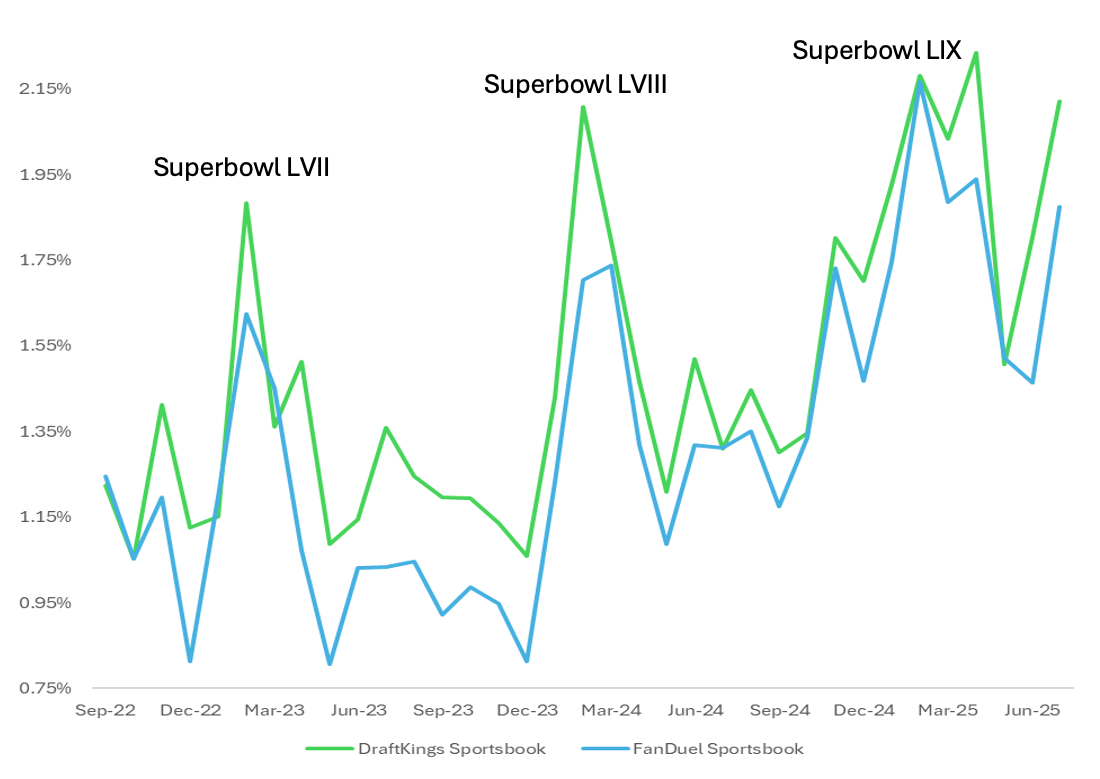
First, Robinhood is launching this partnership at the beginning of the NFL and college football seasons, a time frame which annually accounts for roughly 55% of US card spend for FanDuel and DraftKings (Exhibit 13). This is not exclusive of spend related to football, only to note it is a active betting season.
Exhibit 13: Weekly US card spend, FanDuel & DraftKings, emphasis on NFL football seasons
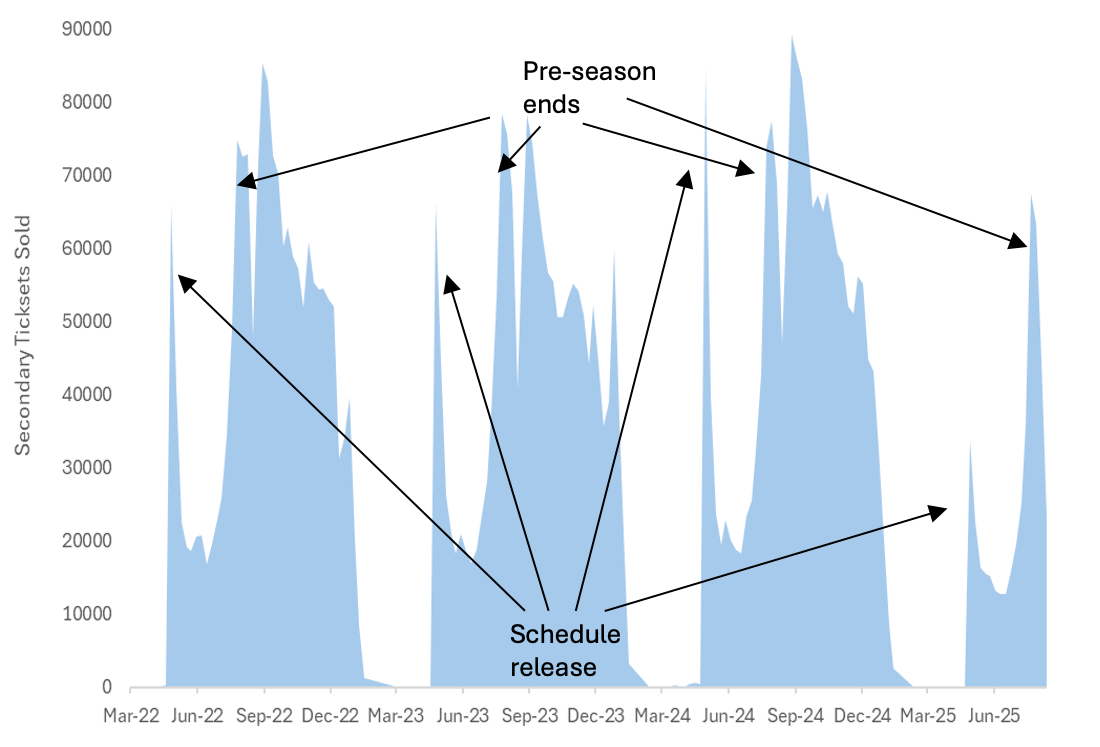
Second, secondary ticket market sales (Exhibit 14) through the end of pre-season 2025 are not only lower than this point last year but were also lower at the launch of the 2025/26 schedule. Both are lower than any other comparable part of the season vs. the prior three years. Additionally, the average resale price of tickets is also lower than these prior years, before even considering inflation.
Exhibit 14: Weekly secondary ticket market sales in decline
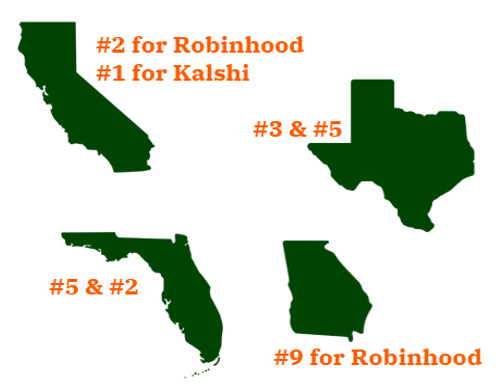
Third, especially Robinhood (because their overall web traffic is much higher), but also Kalshi, already have high a high proportion of their web traffic (Exhibit 15) coming from very valuable states where online sportsbooks are either currently not yet legal, or are severely restricted. The high proportion of traffic coming from Florida should be particularly concerning for Hard Rock Bet where the Seminole tribe’s offering is the only legal online sportsbook in the state.
Exhibit 15: Valuable states along with by ranking of Robinhood and Kalshi web traffic
Lastly, using Carbon Arc’s shared web users metric within Clickstream, we see the proportion who use either FanDuel or DraftKings and also visit Robinhood in any given month (Exhibit 16). While the overlap is not large (max ~3%), it is increasing and tends to spike during active betting periods.
Exhibit 16: Monthly % of overlapping website users with Robinhood
Methodology
Carbon Arc's framework-based approach reimagines how data should be accessed and priced. At its core, our approach recognizes that every data interaction follows the same elegant structure:
Entity + Insight + Filters = Value
- Entity: The subject of analysis (company, brand, person, location, commodity)
- Insight: The specific data point or analytical output you need
- Filters: The dimensions that matter to your use case (space, time, industry, size, etc.)
References
- Pew Research Center, Survey of US Adults, September 2022. https://www.pewresearch.org/short-reads/2022/09/14/as-more-states-legalize-the-practice-19-of-u-s-adults-say-they-have-bet-money-on-sports-in-the-past-year/.